A lot of data is used to characterise virtual machines and quantify the resources available and consumed. and quantify the resources available and consumed.
The user needs tools that organise the virtual machines in the data centre based on their static characteristics or their consumption.
Information
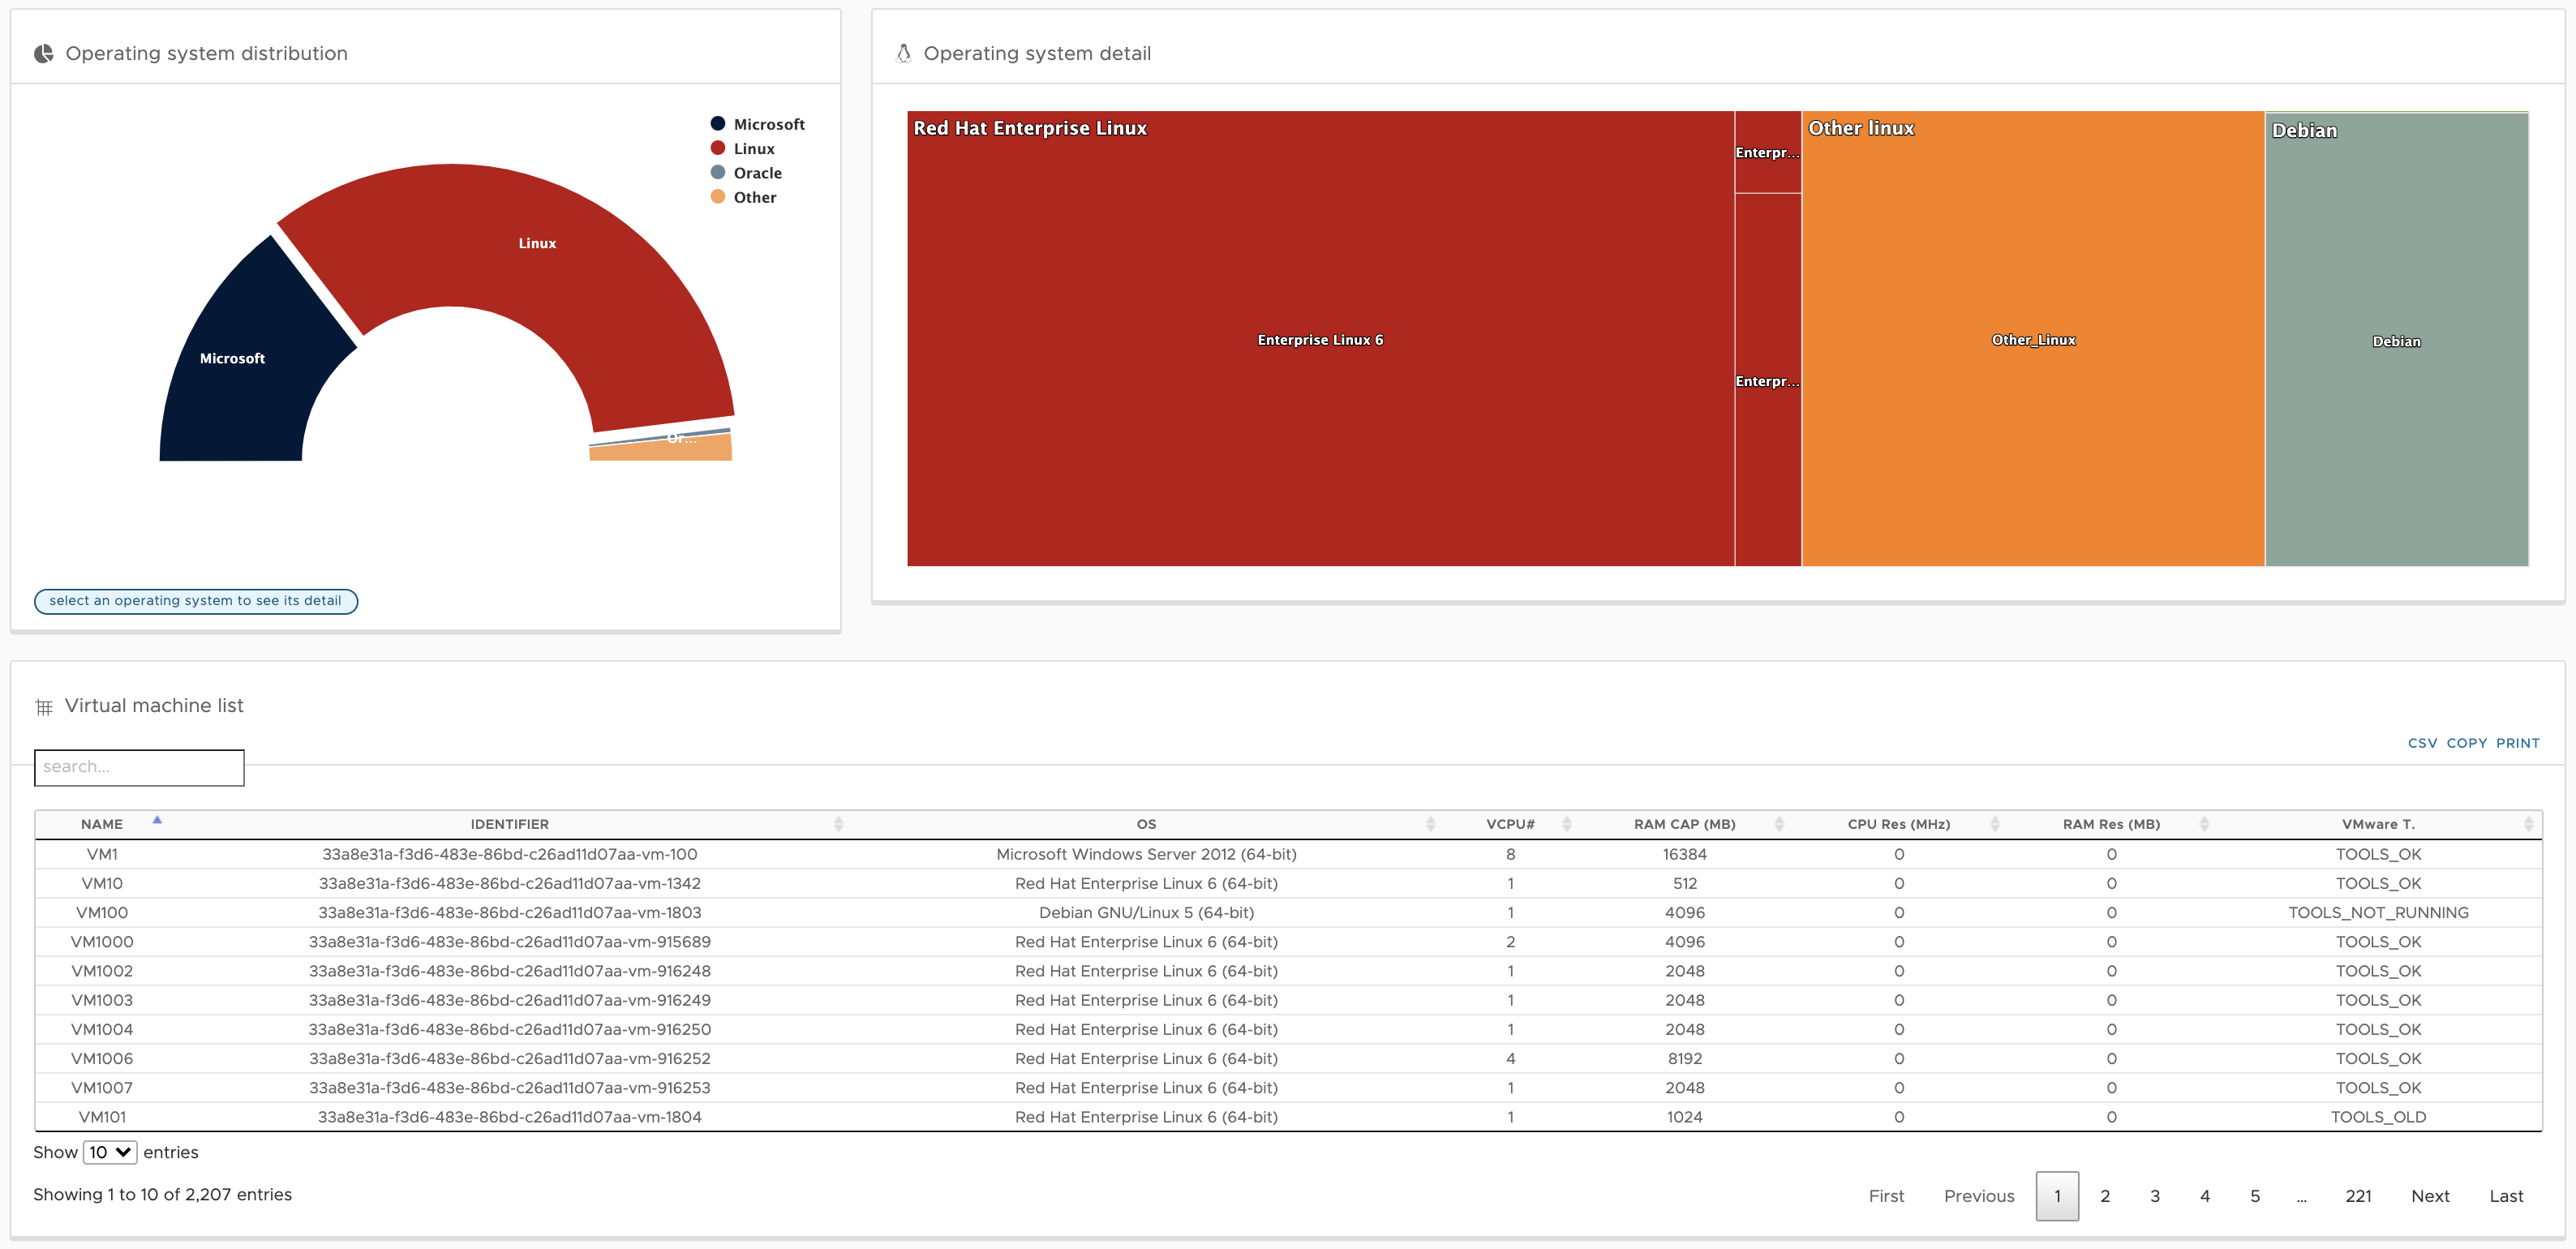
The first tab VM Information tab, groups the static characteristics of of the virtual machines in a table. It also allows you to to visually display the distribution of the OS of your infrastructure and to quickly zoom in on the different versions associated with it. describes the property displayed:
| Item | Description |
|---|---|
| Name: | Name of VM |
| Identifier: | Unique identifier of the VM |
| MAC: | MAC address |
| OS: | Operative system used by the VM |
| VCPU#: | Number of VCPU allocated to the VM |
| RAMCap (MB): | RAM Capacity in MB of the VM |
| CPU Res (MHz): | CPU reserved in MHZ |
| RAM Res (MB): | RAM reserved in MB to the VM |
| VMware T: | Status of VMware tools in the VM |
Some properties are not always available for all virtual machines virtual machines, the value of the property is then equal to Null
Consumption
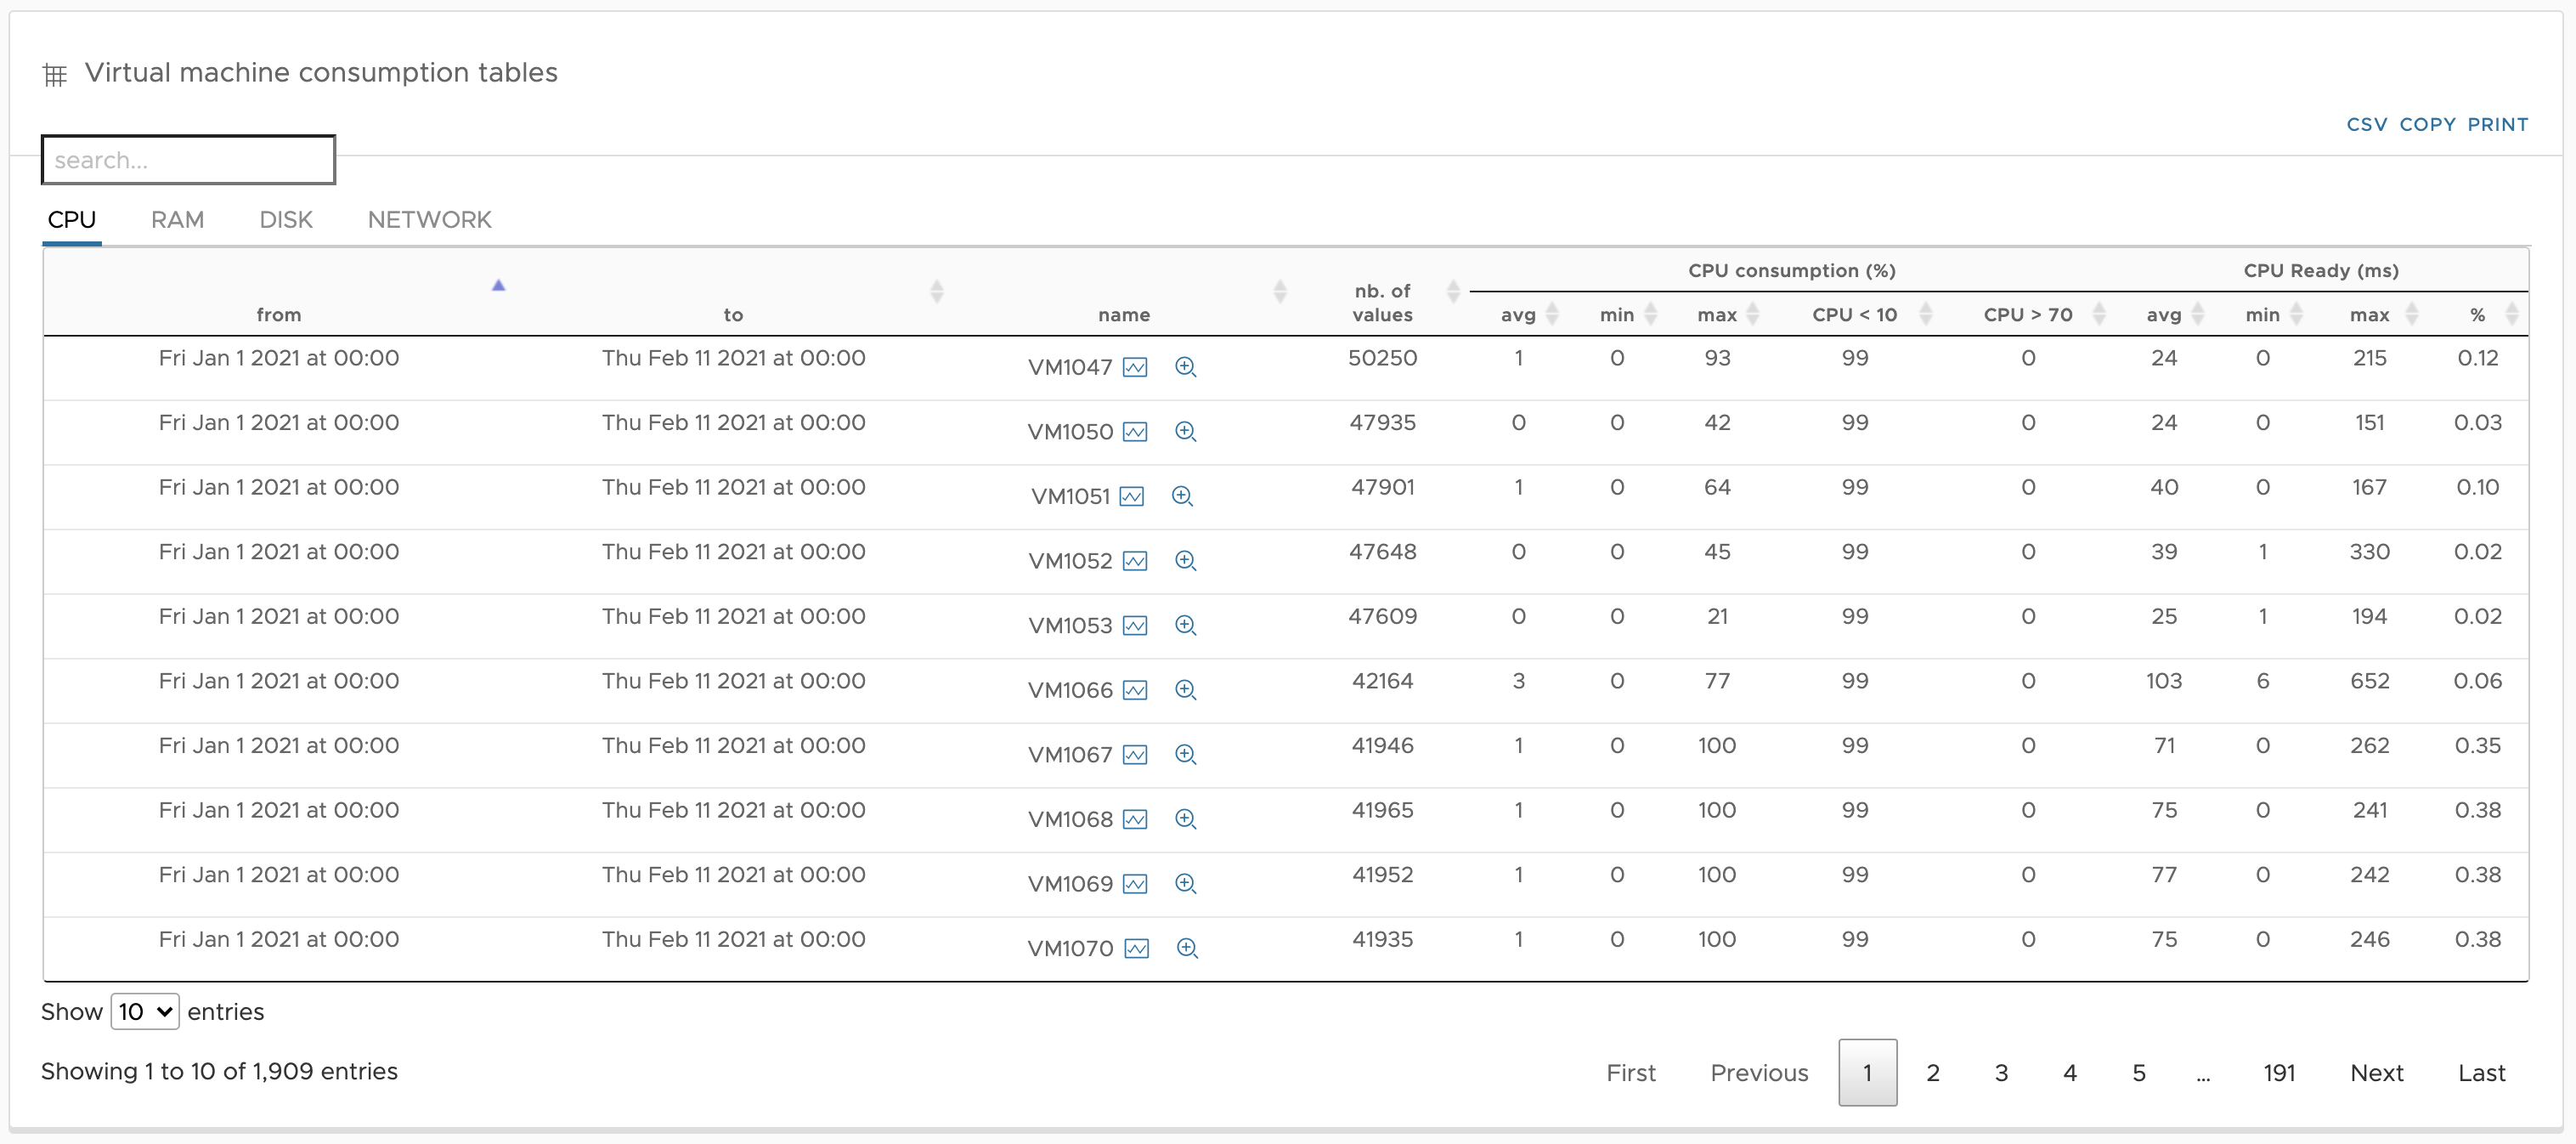
The second tab VM Consumption tab, displays information about the consumption of virtual machines in a table. The consumption of the virtual machines are periodically read and stored in a database. in a database. In order to facilitate the exploitation of these several counters are calculated over a period of analysis which may contain a large number of values.
These different counters are displayed in a table, the name of the column describes the counter displayed The name of the column describes the counter displayed:
| Item | Description | |
|---|---|---|
| Period | Number of period | |
| From | Start data collection date | |
| To | End data collection date | |
| Name | Name of Server | |
| Nb of values | Number of logs of consumptions | |
| CPU Consumption in % | Avg | Average CPU consumption in % |
| Min | Minimum CPU consumption in % | |
| Max | Maximum CPU consumption in % | |
| CPU < 10 | Percentage of logs of where the CPU | |
| CPU > 70 | Percentage of logs of where the CPU consumption is more than 70% | |
| RAM Consumption in % | Avg | Average RAM consumption in % |
| Min | Minimum RAM consumption in % | |
| Max | Maximum RAM consumption in % | |
| IO-Disk Consumption (MB/s) | Avg | Average disk consumption in MB/s |
| Min | Minimum disk consumption in MB/s | |
| Max | Maximum disk consumption in MB/s | |
| IO-Net Consumption (MB/s) | Avg | Average network consumption in MB/s |
| Min | Minimum network consumption in MB/s | |
| Max | Maximum network consumption in MB/s | |
| CPU Ready (ms) | Avg | Average waiting time to access the CPU |
| Min | Minimum waiting time to access the CPU | |
| Max | Maximum waiting time to access the CPU | |
| % | ||
| Disk latency (ms) | Avg | Average waiting time to access the disk |
| Min | Minimum waiting time to access the disk | |
| Max | Maximum waiting time to access the disk |
Some consumptions are not always available for all virtual machines, the value of the consumption is then equal to Null.
By clicking on the name of a virtual machine, a zoom is performed to divide the to divide the analysis period into several smaller periods. Using this feature, the user can precisely analyse the consumption of a virtual machine. The minimum analysis period is one hour.
Synthesis
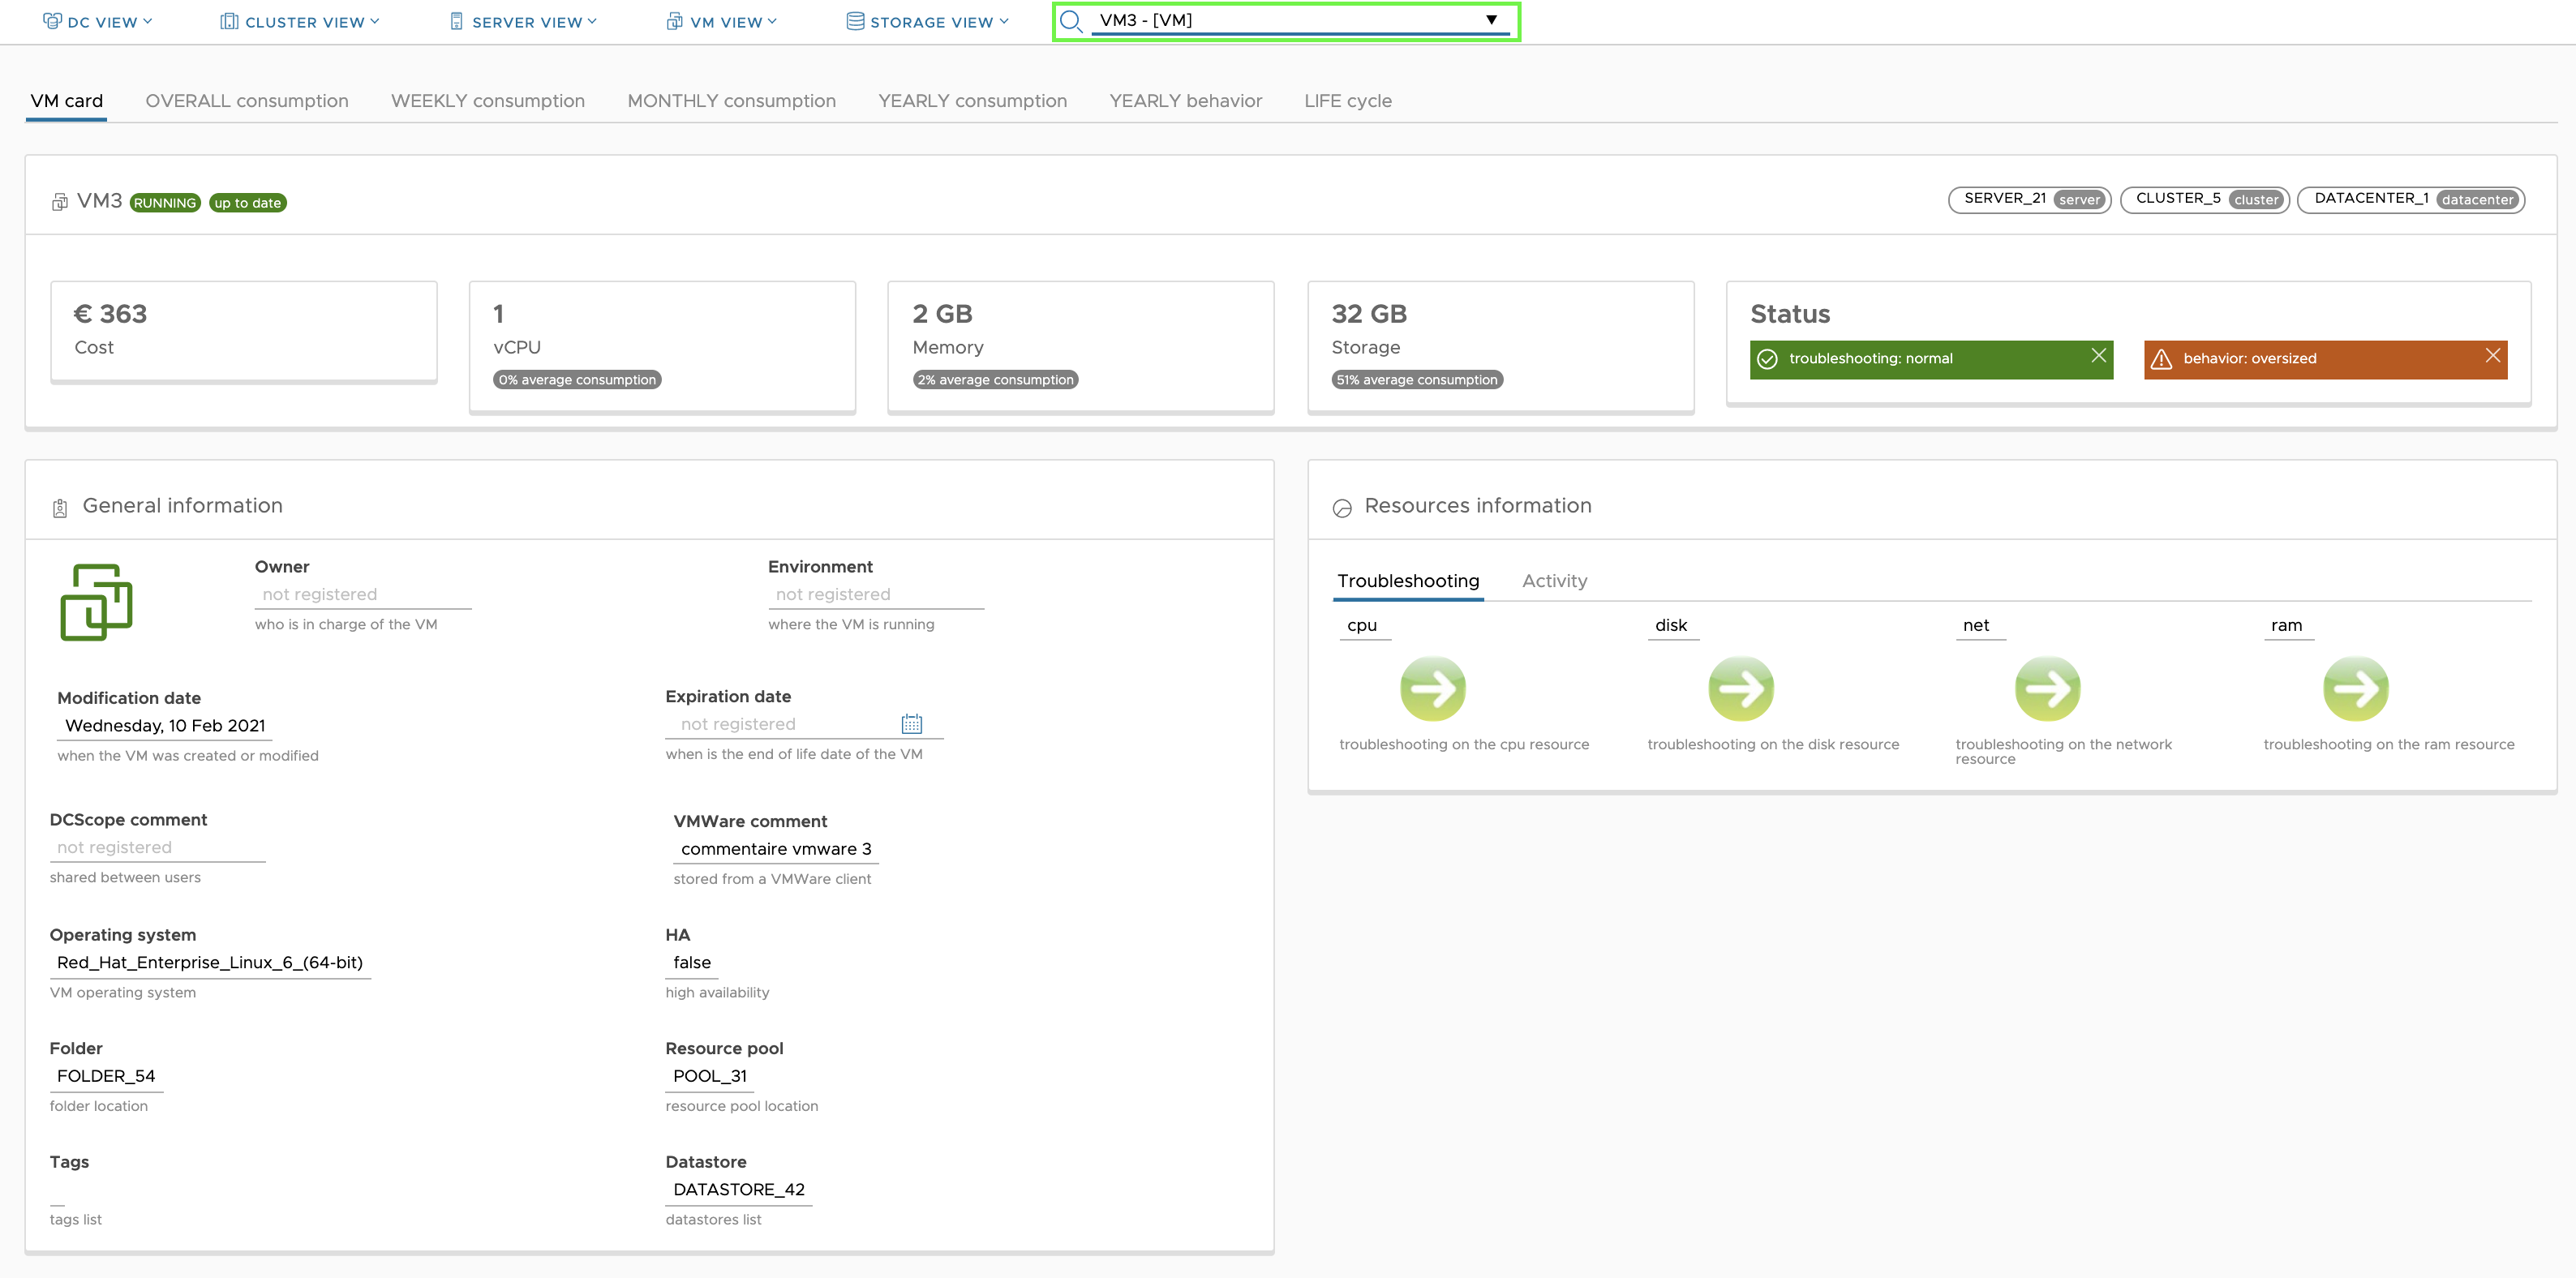
The third tab VM Synthesis tab gives a detailed overview of each VM. To select a particular VM, simply enter its name in the search bar at the top of the the search bar at the top of the screen and the various details will appear. will appear.
General Information
All these views allow you to obtain a detailed detailed overview of a particular VM. This section transcribes the analysis of all the changes during the lifecycle of the virtual machine. virtual machine. Once a VM is selected, a complete screen with details appears.
The colour of the VM logo represents the behaviour of the VM.

Location information
This frame provides the location information of the VM. It will list the host, folder, resource pool, datastore and tags associated with the VM.
System Information
The system information will provide information regarding the operating system in the VM, the status of VMware tools, the status of the VM in the datacenter, the behavior status of the VM, the troubleshooting status and the configuration of High Availability of the VM.
Other boxes contain technical information. We can find:
- the OS used by the VM.
- Its status - If the VMware tools are installed and up to date.
- If the VM has a high availability property.
- Its behaviour (normal, idle, etc...).
- The health state of the VM corresponding to the troubleshooting.
- The number of VCPUs of the VM on the whole ESX.
- The RAM allocated for the VM compared to the server.
- The provisioned storage compared to the capacity of its datastore(s).
- On which server, folder and datastore the VM is located.
- The tags and resource pool.
Activity vs Capacity The last part of the synthesis is a radar for VM. It allows you to compare a selected VM against the data of an average data of an average VM. Different points are compared:
- CPU activity
- CPU capacity
- RAM activity
- RAM capacity
- Troubleshooting
- Storage capacity
This radar allows you to quickly identify where the VM needs to improve and/or is performing well.
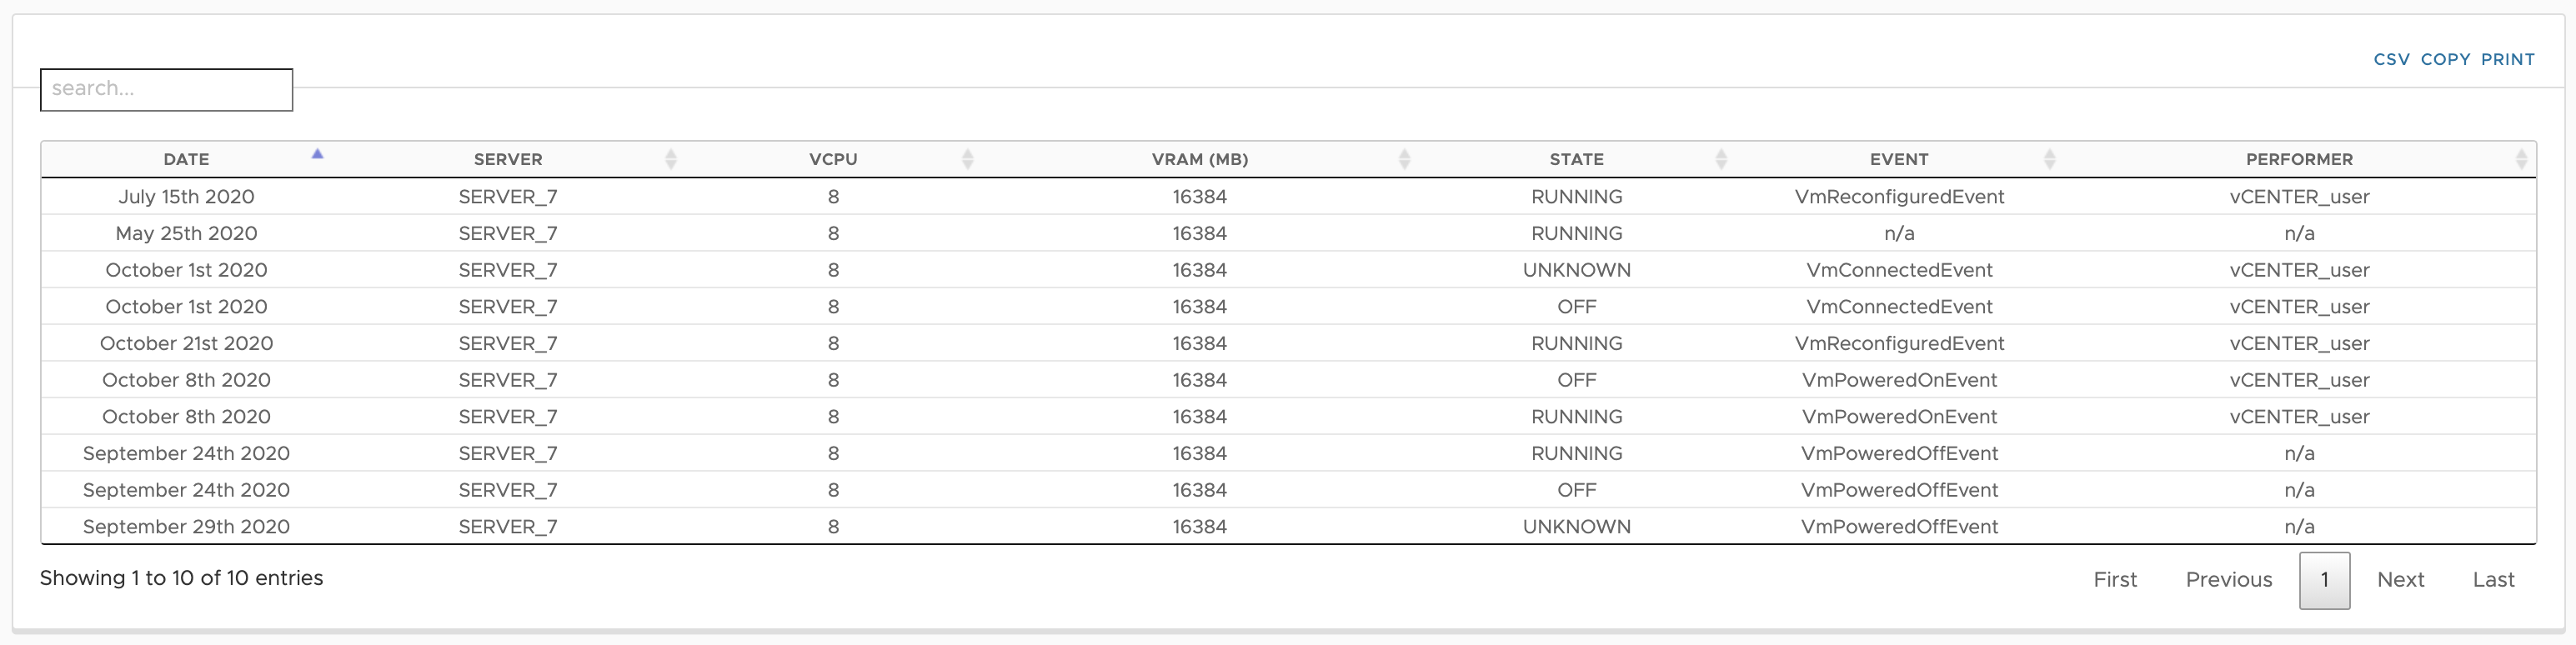
VM Life Cycle
By clicking on the symbol in the "Location information" tab, it is then possible to visualise the migrations of the virtual machine virtual machine on another physical server, configuration changes or configuration changes or status changes.
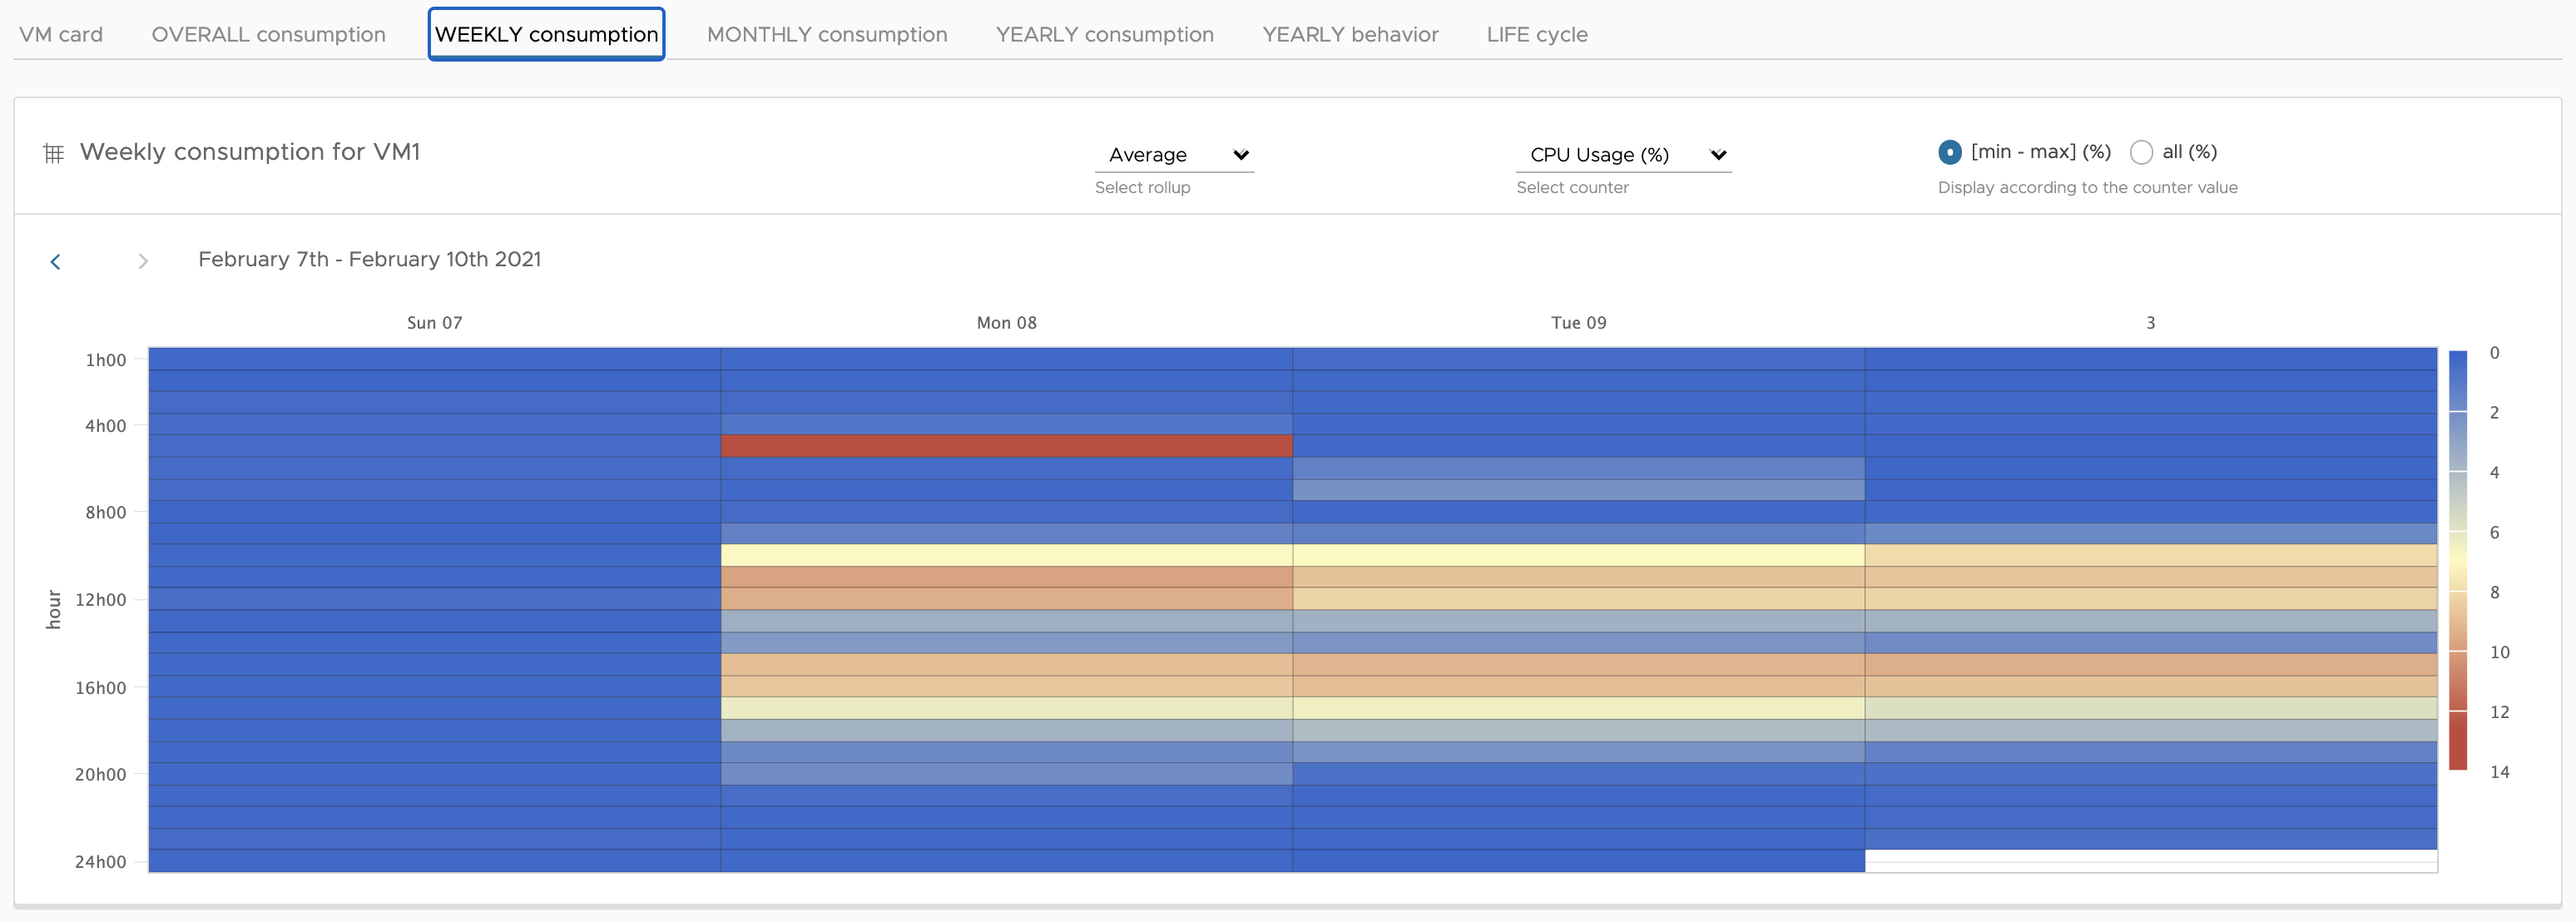
Weekely Consumption / Monthly Consumption / Yearly consumption
In order to visualize the weekly consumption rates Average - Max and Min of CPU and RAM resources for each element. This graphical view allows you to identify the peak times in the use of these resources.
At the top right of the table you can select the granularity, the counter and the resource.