The troubleshooting has two objectives:
- To quickly identify VMs that are deteriorating, to anticipate anomalies.
- To provide explanations and correct recurring problems.
DC Scope:
- analyses all VMs or only the VMs of a selected filter
- examines these VMs according to the thresholds exceeded
- displays according to 2 codes visual codes: a more or less oriented arrow and a colour (red, This is the only way to get the most out of the system.)
| * | * | * |
|---|---|---|
| 1 Time beyond a threshold of best practices | = | 1 Point according to the threshold exceeded. |
| Color of the arrow | Direction of the arrow |
|---|---|
  |
  |
Direction of the arrow Indicates the evolution of the " health" of the VM :
- downwards: improvement
- upwards: deterioration.
The operating principle is as follows: The analysis period The analysis period is divided into two (period A and B). For each resource (cpu, disk and network) the number of points that exceed the thresholds set on the red criterion in period A and then in period B. If there is the same number of points between the 2 periods then the arrow is "flat". If zone B contains at least 5% more points more than the A area then the arrow is ascending. If area A contains more points than area B then the arrow is "descending". down".
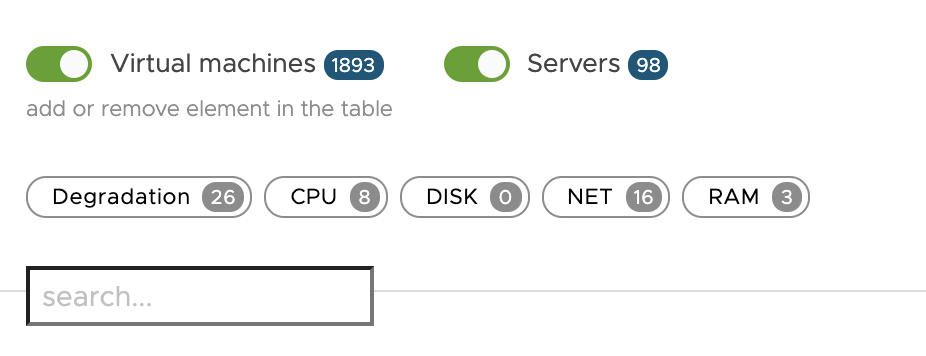
Filtering and sorting
The filter allows you to display the GENERAL STATUS of the VMs that respond to a resource (cpu for example). It displays the colour and the arrow of the general state (most degraded resource and most critical state). The critical filter displays all VMs whose the tilt angle on one of the three resources (cpu, disk or net) is positive. The filter cpu filter displays all VMs whose colour orange or red on the cpu resource and whose arrow tilt is positive arrow is positive in cpu. The "disk" filter displays all the VMs whose the colour is orange or red on the disk resource and the the slope of the arrow is positive in disk. The net filter displays all VMs whose colour is orange or red on the network resource and whose arrow slope is positive in network. The sorting can be done by VM name or by the degree of slope of the arrow of each resource.
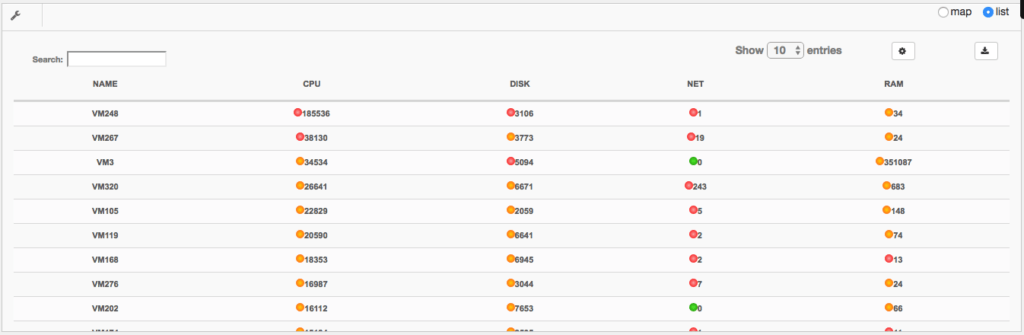
List view
It is possible to view in list form, the sorting is different. This view gives all the red points over the whole period and on all metrics.
Thresholds of Best Practices
For each resource there are two thresholds that should not be exceeded (orange and red) which correspond to two different levels of values.
For each resource, one or more metrics are analysed:
CPU resource
| Item | Description | Orange | Red |
|---|---|---|---|
| Too much CPU activity on host | CPU overload at the hypervisor level (too much ready on VMs, waiting to give access) | 5 % | 10 % |
| Too much VCPU on VM | CPU overload at VM level (high COSTOP counter, too much VCPU allocated) | 1 % | 3 % |
| Virtual machine overload | Overload to "inside the VM | 90 % | 95 % |
DISK resource
| Item | Description | Orange | Red |
|---|---|---|---|
| Controls failed | Number of SCSI disk drives lost | 1 | 5 |
| Total latency | Average time to read and write on the disk | 20ms | 30ms |
RAM resource
| Item | Description | Orange | Red |
|---|---|---|---|
| Virtual machine overloaded | Virtual machine overloaded | 70% | 90% |
NET resource
| Item | Description | Orange | Red |
|---|---|---|---|
| Lost packets | Number of lost network packets | 1 | 5 |
Direction of the arrow
| Arrow | Points | Description |
|---|---|---|
|  |
  |
As many points exceed the red threshold, in period A as in period B, this gives a horizontal arrow. |
|  |
  |
No points above the red threshold gives a horizontal arrow |
  |
Fewer points exceed the red threshold in period B than in period A, this gives a downward arrow. | |
|  |
  |
At least 5% more points exceeding the red threshold in period B gives an upward arrow. The greater the difference in the number of points between the 2 periods, the greater the angle of inclination of the arrow. |
Color of the arrow
The colour indicates whether the VM has more or less exceeded good practice thresholds (see Good practice thresholds). (see Good Practice Thresholds) at the end of the analysis period. analysis period.
- red & orange: thresholds exceeded
- green: below the thresholds
For each resource (cpu, disk and network) the number of points that exceed the For each resource (cpu, disk and network), the number of points that exceed the thresholds set for the red and orange criteria is counted for the last 5 percent of the analysis period (period C). If X% of the total points are red over the period C then the colour is red otherwise if If X% of the total points are orange over the period C then the colour is orange otherwise the colour is green. The diagrams below illustrate the colour:
| Arrow | Points | Description |
|---|---|---|
|  |
  |
Area C corresponds to the last 5% of the total analysis period (A + B) .20 points in total over the whole analysis period. 2 red points in period C, i.e. 5% of the total points. The colour is therefore red. |
  |
  |
10 points in total and exceeding the amber threshold but not the red threshold over the whole analysis period. 2 points in period C i.e. 20% of total points. The colour is therefore orange and all the points are in the B zone which gives a maximum tilt. |
|  |
  |
30 points in total and exceeding the orange threshold over the whole analysis period. Only 1 point in period C or 3.3% of total points. The colour is green. |
  |
30 points in total and exceeding the amber threshold over the whole analysis period. No points in period C. The colour is green. | |
|  |
  |
50 points in total. 3 and 5 points respectively exceeding the red and orange thresholds, i.e. 6% and 10% in period C. The colour is therefore red (priority over orange). |
Note that the threshold for zone C is configurable (by default at 5%), it to adjust the display of very critical VMs at the end of the period
Troubleshooting use case
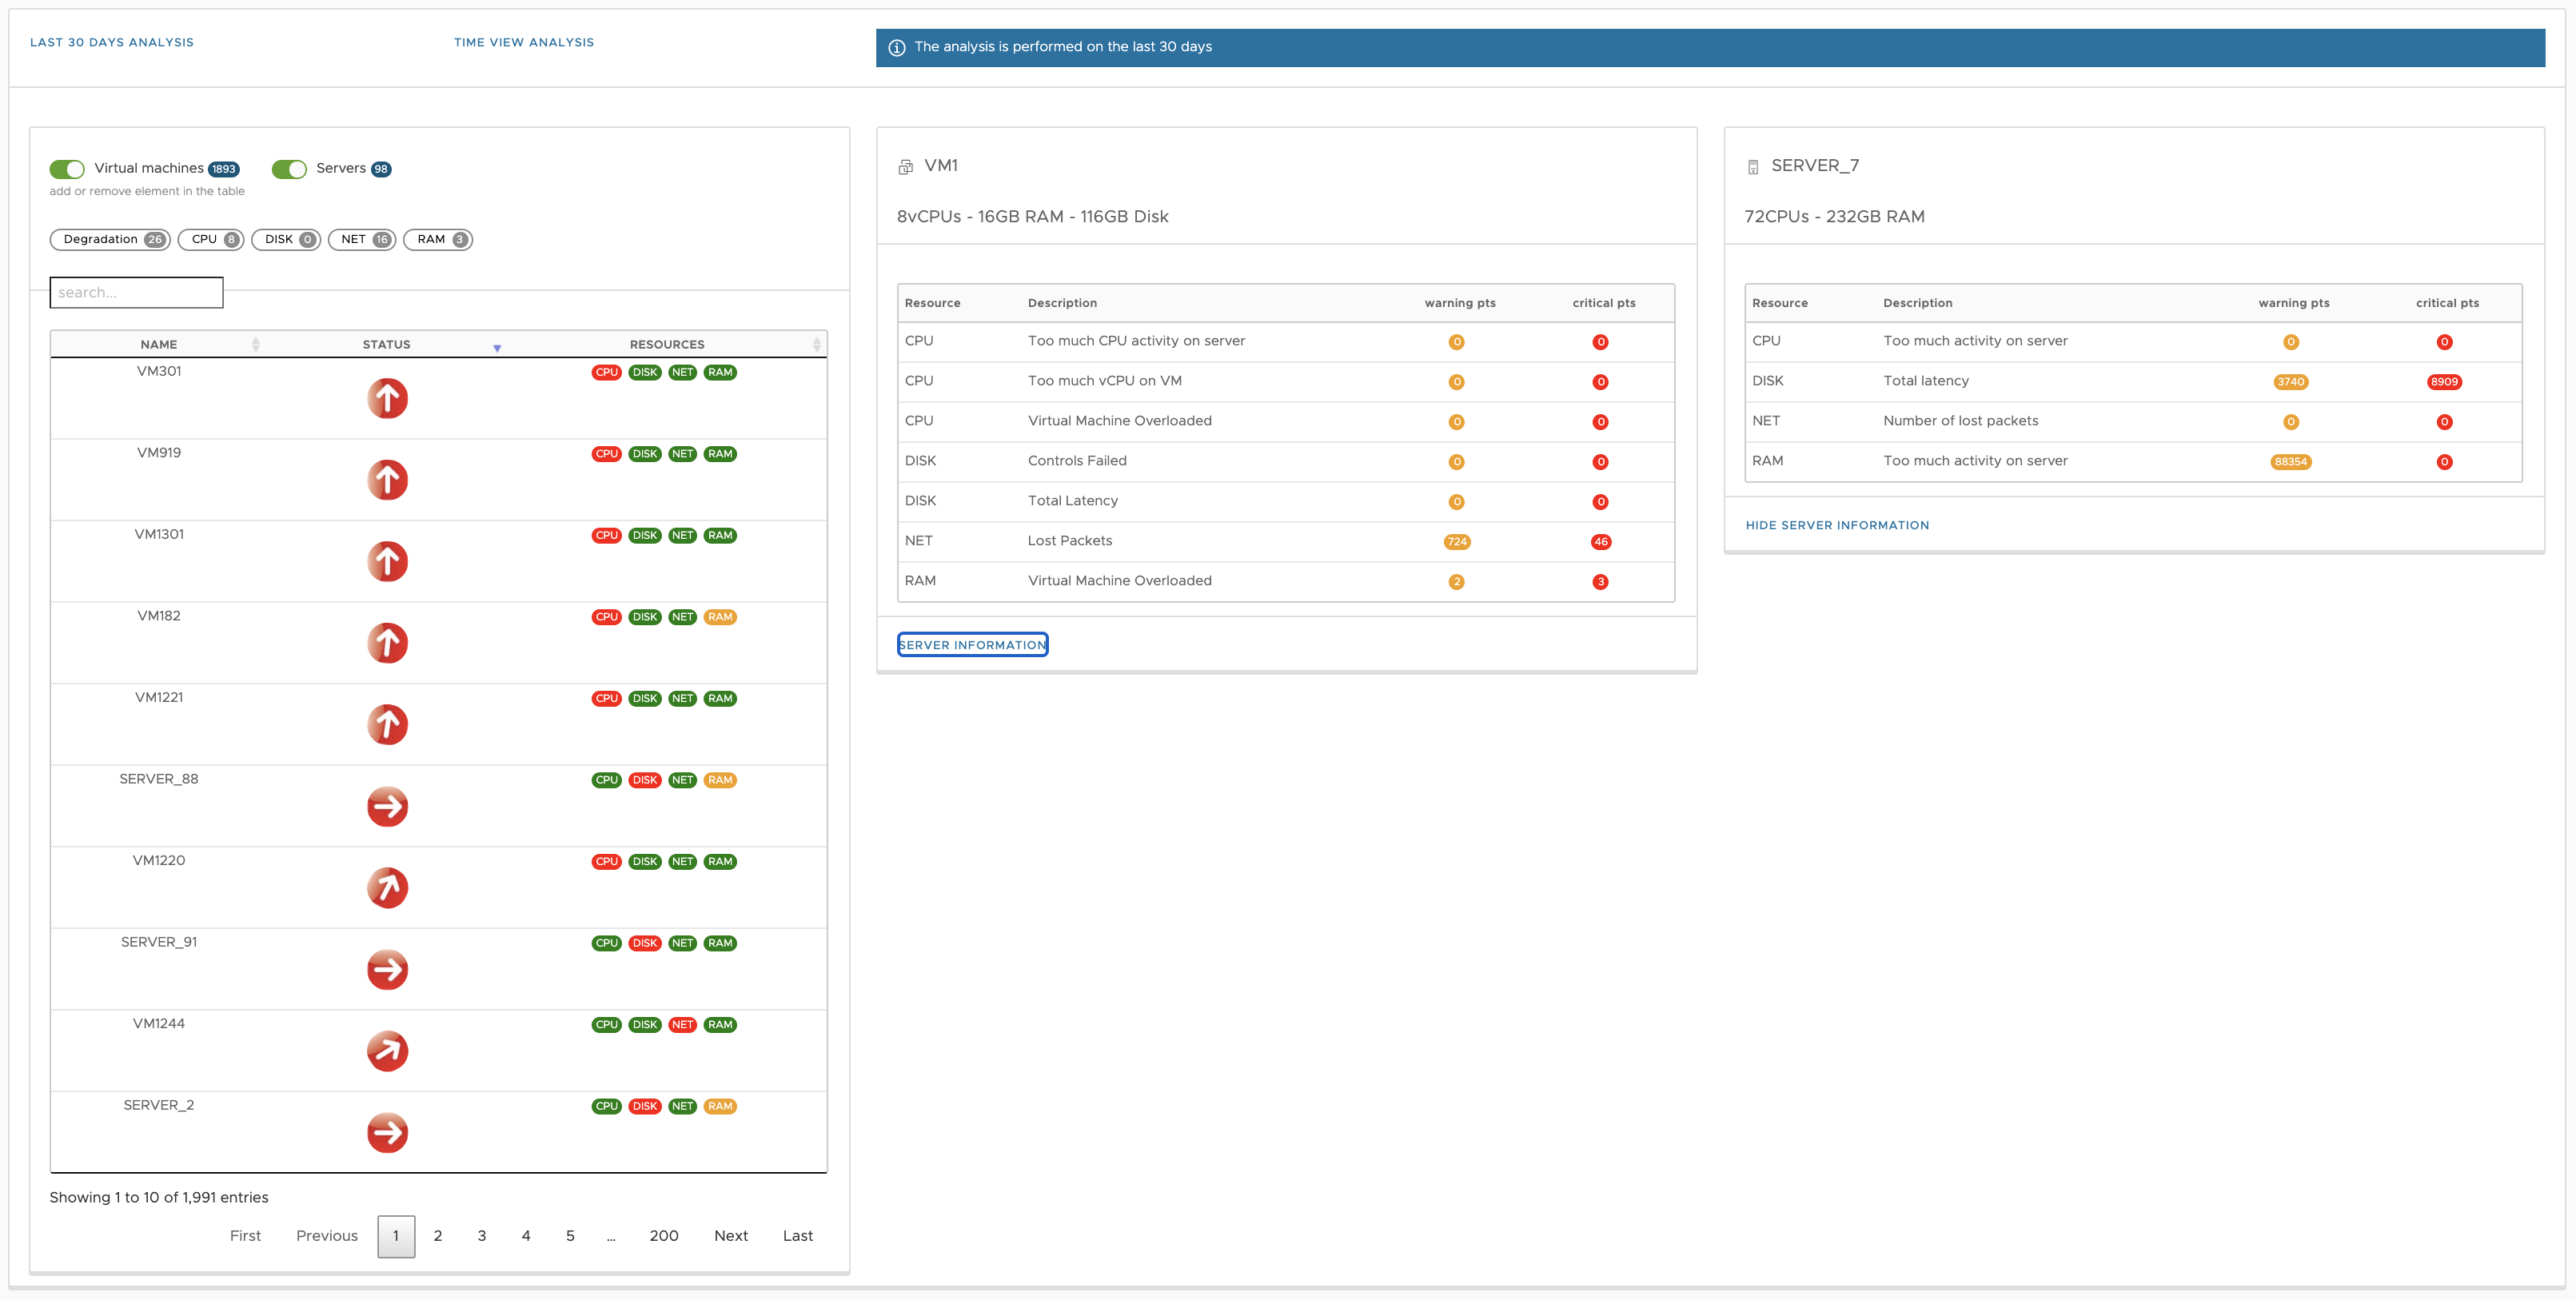
1 - A click on degradation highlights the VMs concerned by this state, they are red and in degradation.
2 - It is possible to know more about it, by clicking on the desired VM and detect where the problem comes from.
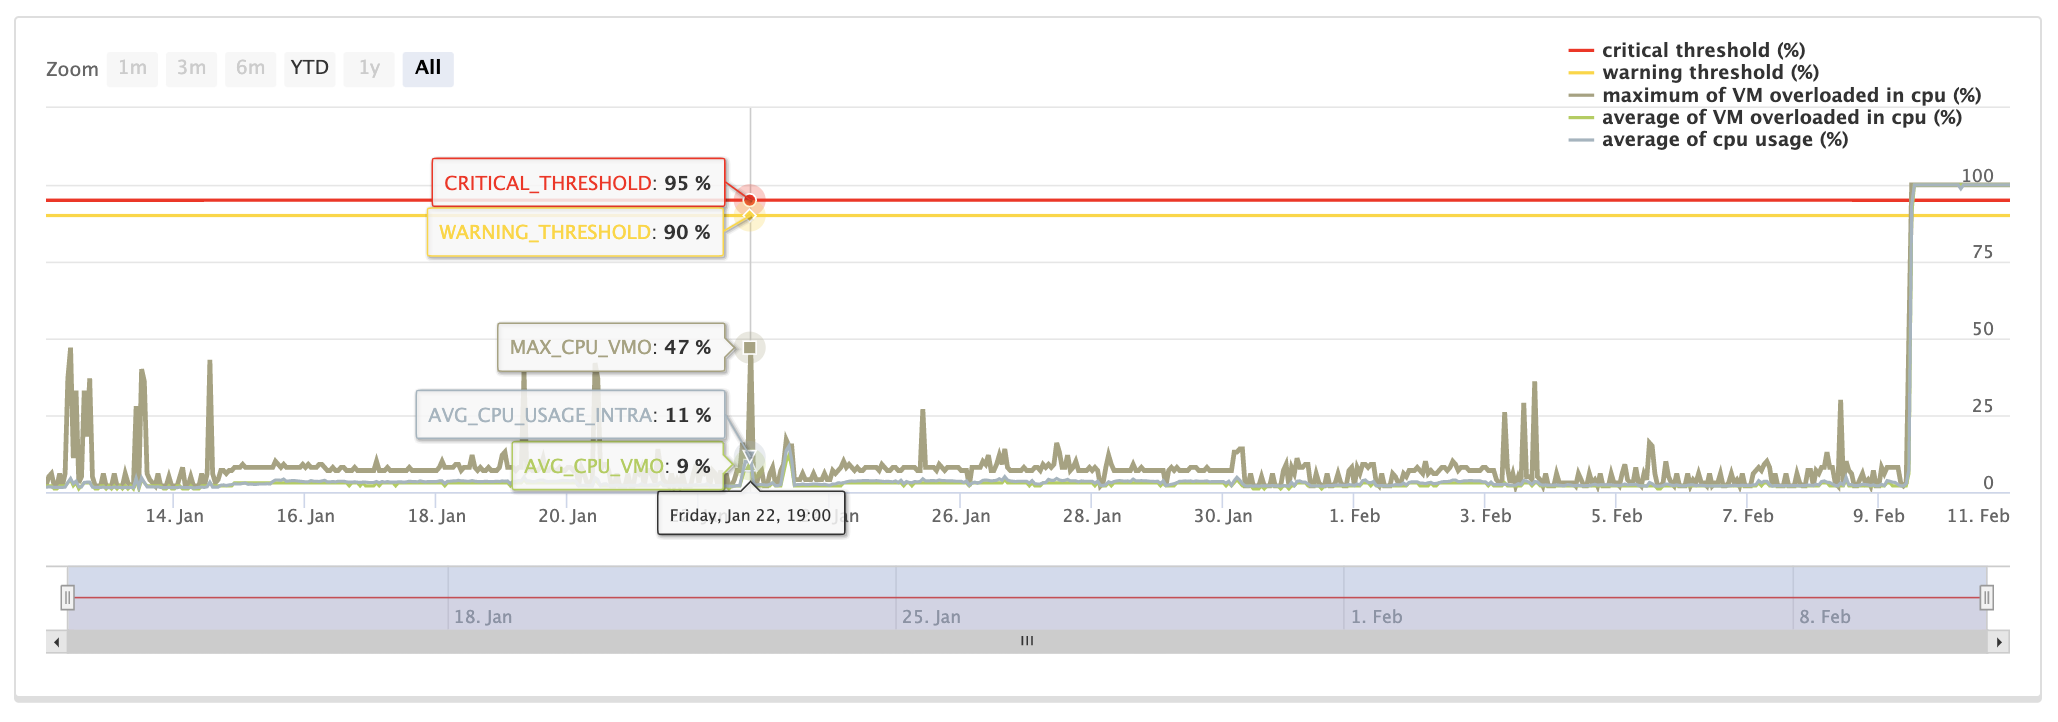
3 - In this case, the problem comes from the CPU. To identify it clearly, click on it.
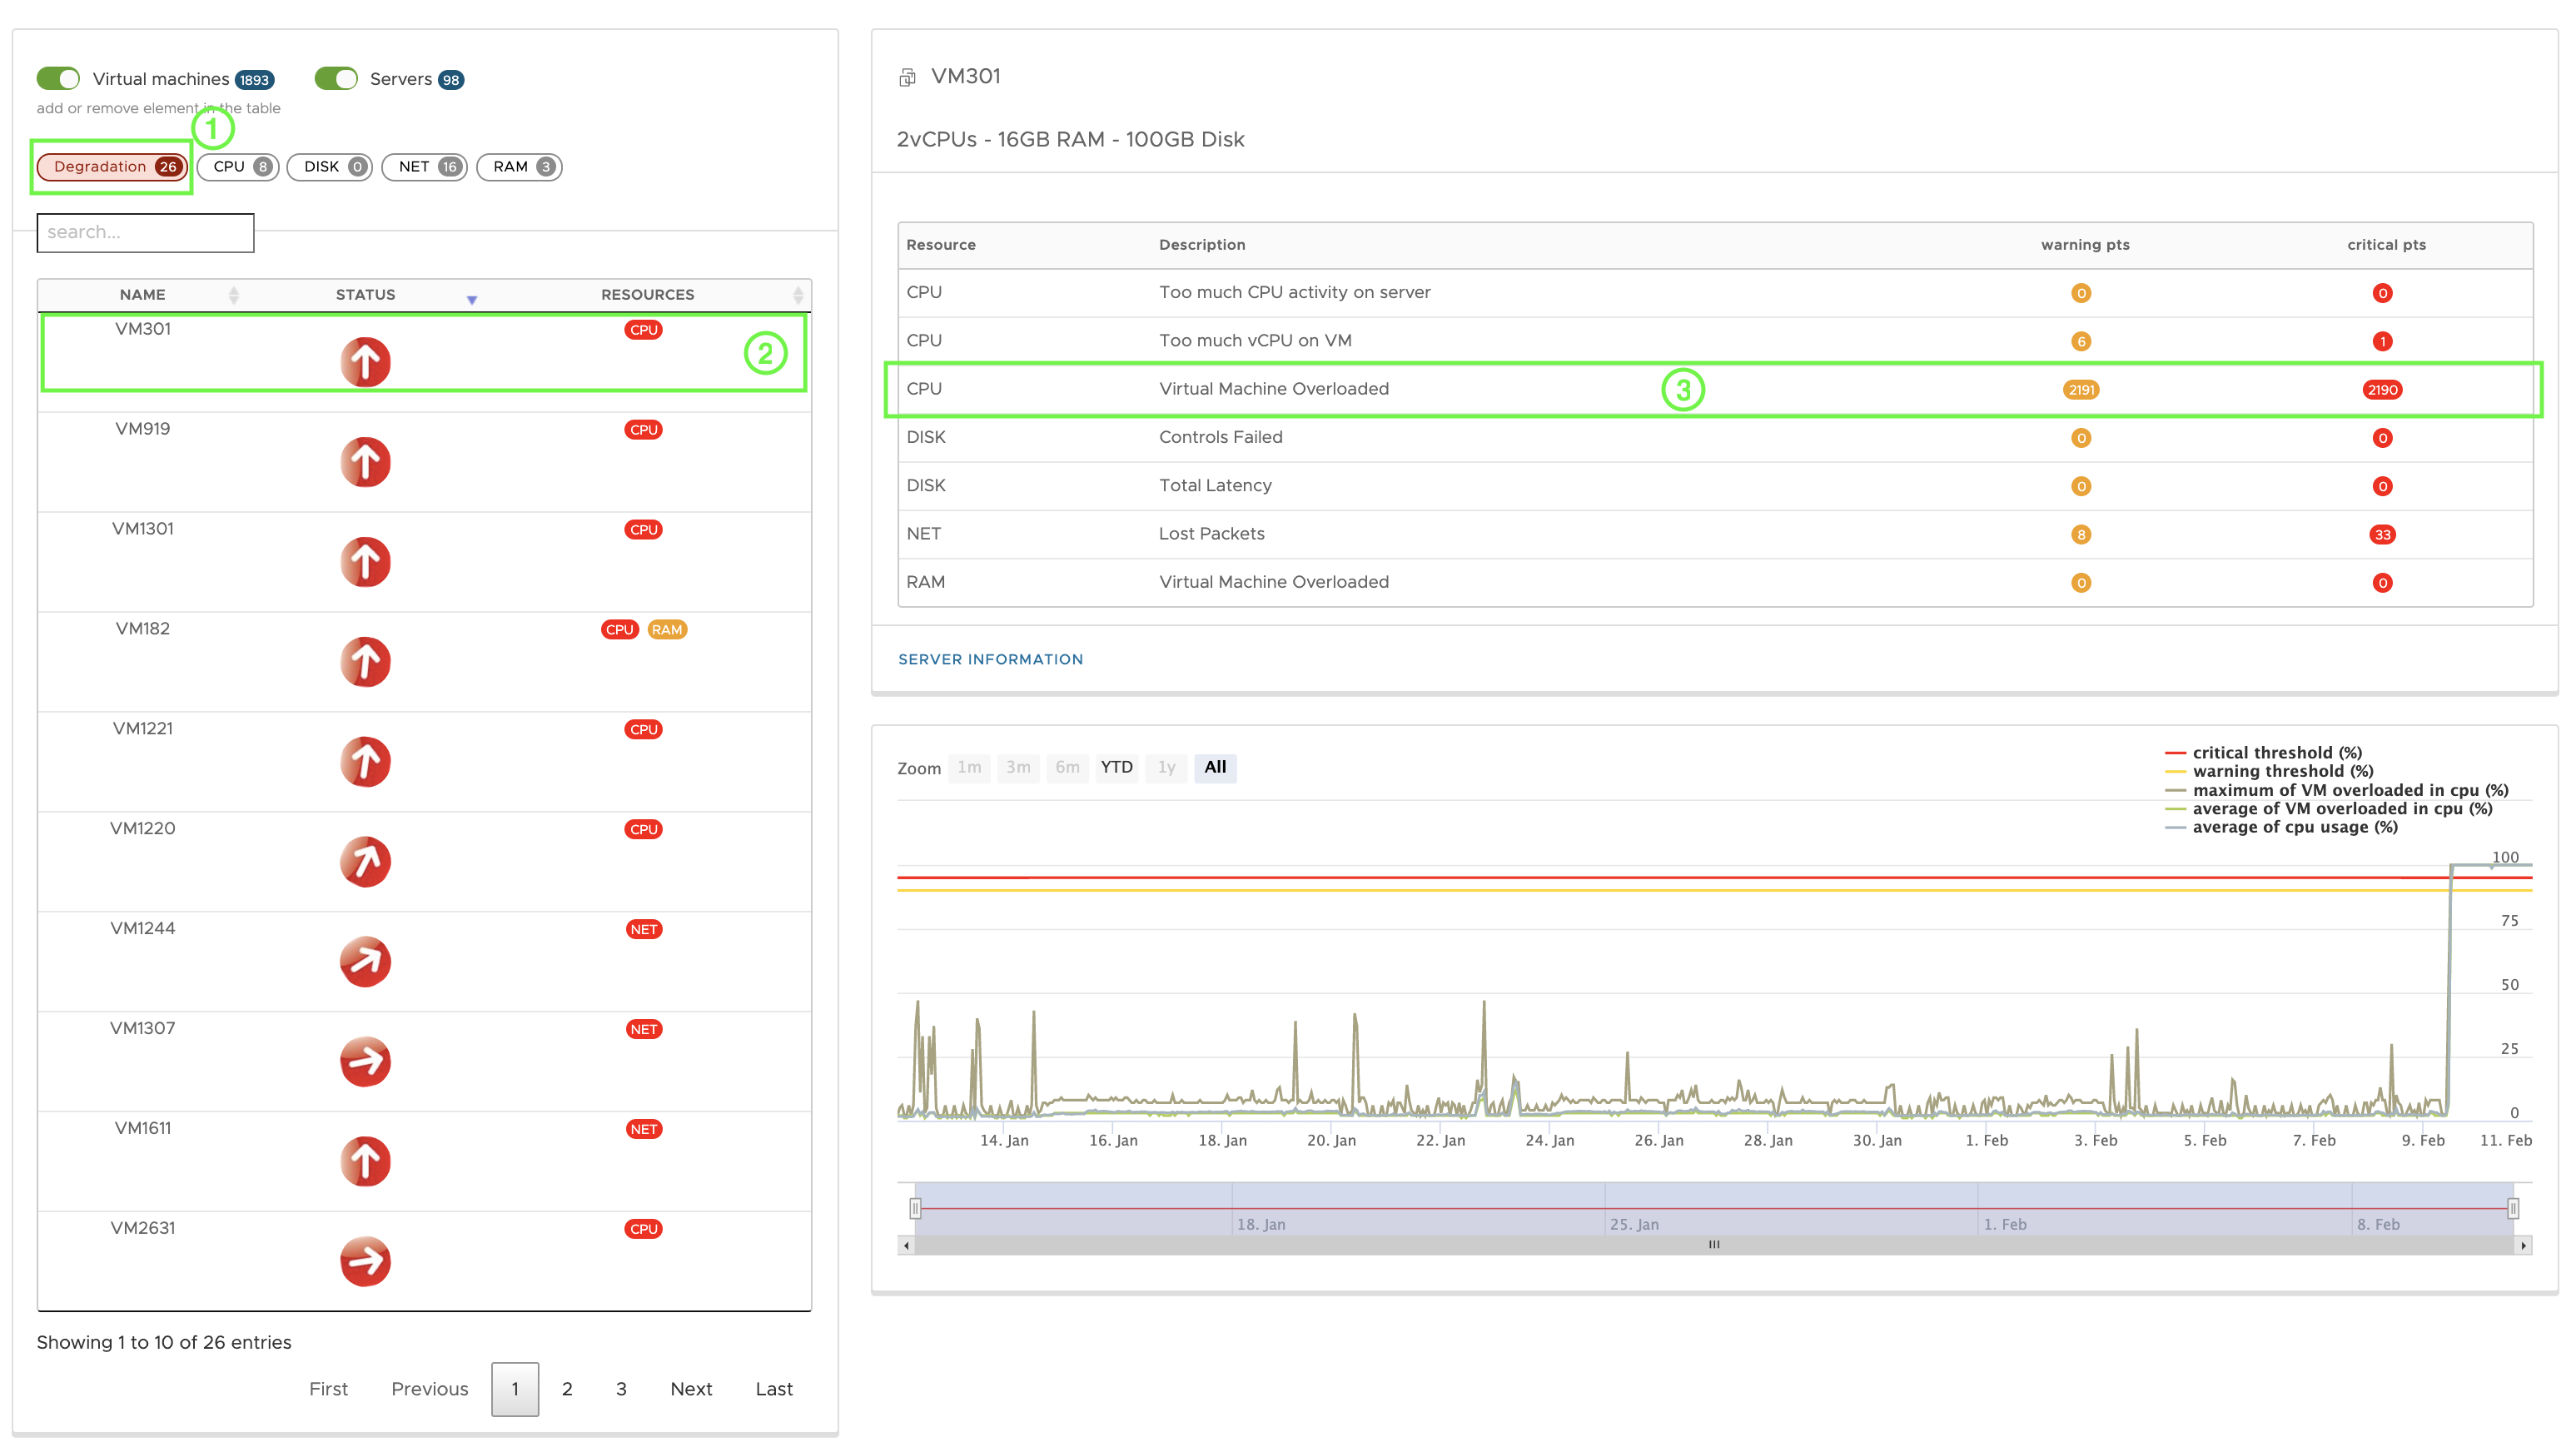
Click on the curve to get more details and zoom in on the points, get the MIN, MAX, MOV and points, get the MIN, MAX, MOY....