This section allows you to quickly observe the state of the VMs, to see what are the possible This section allows you to quickly observe the state of the VMs, to see the possible levers for optimisation, and to access simulations of infrastructure consolidation. It is divided into three cards located at the top of the screen:
- Operation: This summarises the operational status of the VMs present on the infrastructure. For example, it is possible to know the number of VMs
idleor the number of VMs requiring action in relation to the VMware tools. - Resizing: Gives an overview of the possible optimizations on the VMs resources and the savings that these optimizations would generate.
- Consolidation: allows you to simulate the state of the infrastructure if there were a reduction in the number of servers.

Operation
By clicking on the More... button associated with the Operation card, a card summarising the operational status of the VMs in table form appears at the bottom of the screen:

The table presents for each VM information such as recommended actions, the date of last modification, the status of the VMware tools, its operating status, and how its resource allocation is in relation to its needs. Finally, on the right hand side of the table there is a column containing gauges: this is the distribution of the daily states of the VMs over the duration of the current filter. The following figure summarises the meaning of the colours:

For example, in the screenshot below, the VM presented the following profile:
- 96% of the time it was detected
oversized - 3% of the time it was detected
idle - 1% of the time it was detected
lazy

You can have the semantics of the values in the Behavior column by consulting the Glossary.
Resizing
By clicking on the More... button associated with the card Resizing,
a card summarising the main resource optimisations in table form appears at the bottom of the screen:

In the card of the environment corresponding to the RAMresource type, the following is indicated for each recommendation
the level of aggressiveness of the recommendation in RAM:
securesecure: recommendation that takes into account the memory consumed (memory consumed) to propose a new memory allocation.aggressiverecommendation that takes into account the memory consumed counters (memory consumed) and active memory (memory active) to propose a new memory allocation.
Note
The aggressive mode minimises the memory allocation of the VM and is mainly intended for cases where
for cases where it is necessary to free up space on a server hosting VMs.
The application of an aggressive recommendation can lead in some cases (especially for databases) to performance drops (swapping),
We advise to carefully study the application situation of a VM and its memory needs before applying an aggressive recommendation.
By clicking on the DETAILS VIEW button, the following screen will appear at the bottom of the screen:

This view details, for each resource type CPU, RAM and DISK the optimisations that DC scope proposes to implement.
For each recommendation linked to a VM, an overview is given of its resource consumption.
Consolidation
By clicking on the More... button associated with the card Consolidation,
a card appears at the bottom of the screen, allowing access to the consolidation simulation tool:
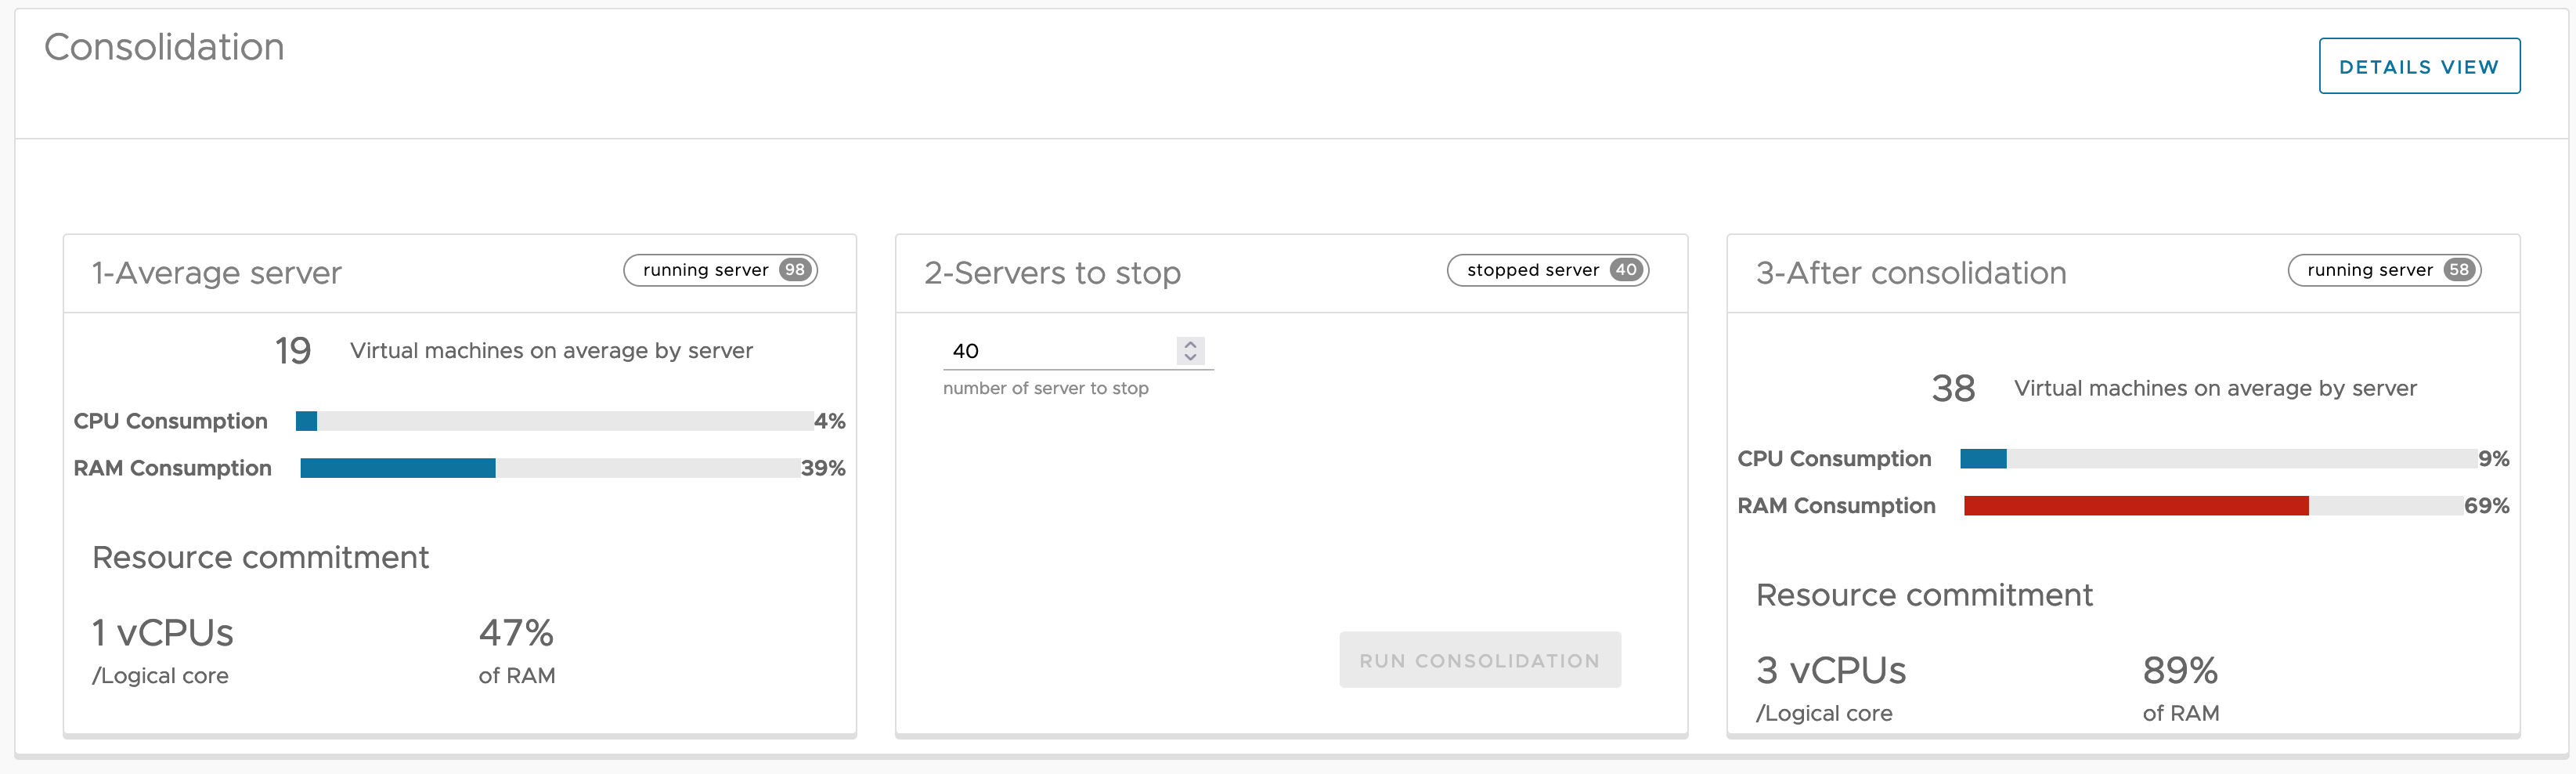
This screen allows you to simulate the state of the infrastructure if there were a reduction in the number of servers (for example, following a loss of a server room, or following a consolidation to save on electricity costs). The screen is divided into three parts:
- The left card gives an overview of the number of active servers and their average utilisation rate.
- The middle card allows you to select the number of servers that will be switched off during the simulation
- The right card gives an overview of the utilisation rate after the reduction of the number of servers.