Once the user is logged in, the Dashboard appears. The dashboard provides a status report of the data centre the status of the data centre in three areas: the status of the data centre, the capacity management and possible optimisations. These three axes are represented by three columns broken down into two frames.
Status of the Datacenter
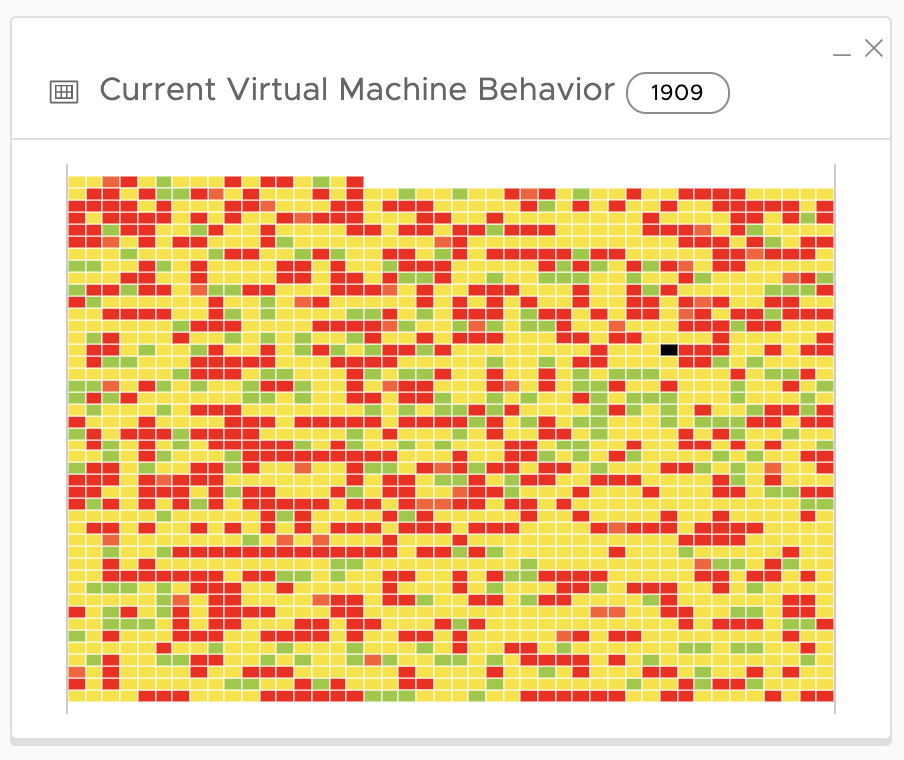
The first column draws the user's attention to the current status of the of the datacenter. The first frame provides a view of all running virtual machines (running) in the data centre. data centre. Each virtual machine is represented by a coloured square. square. The colour varies according to the status of the virtual machine.

The consumption values (processor and memory) used are the average, over the average, over the period analysed, of the processor and memory memory consumption reported by the virtual machine's operating system.
A high processor consumption can degrade the performance of a virtual machine. This behaviour must therefore be analysed by the user who will decide on the operations to execute. Hovering over a hovering over a square gives the name, status of the processor, RAM and CPU. The appearance of the message no available data means that no consumption has been recorded.
By clicking on the square representing a virtual machine, you are redirected to the then redirected to the consumption curves of this virtual machine.
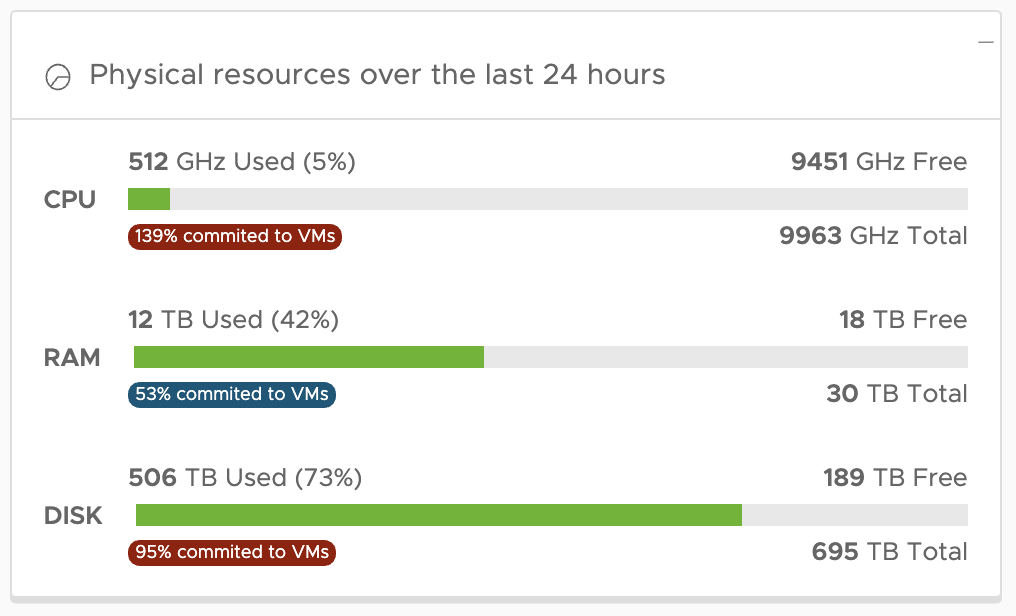
This frame shows the usage status of the servers in the data centre over the last 24 hours. Three resources are analysed: memory memory consumption, processor consumption and storage. storage. For these resources, the average consumption (USED) is reported over the period in question. reported over the period in question. The blue indicator shows what has been allocated to the virtual machines.
Evolution of the datacenter
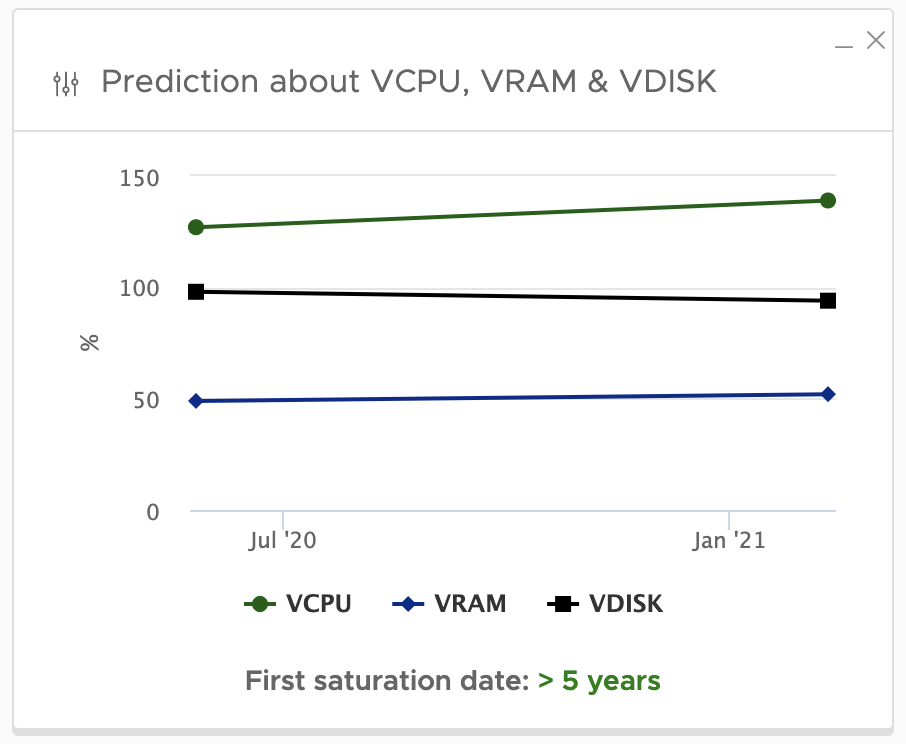
The central column shows two boxes related to capacity planning.
The first frame displays the trend of the allocated data of the VRAM, VCPU and VDISK counters and the first saturation date.
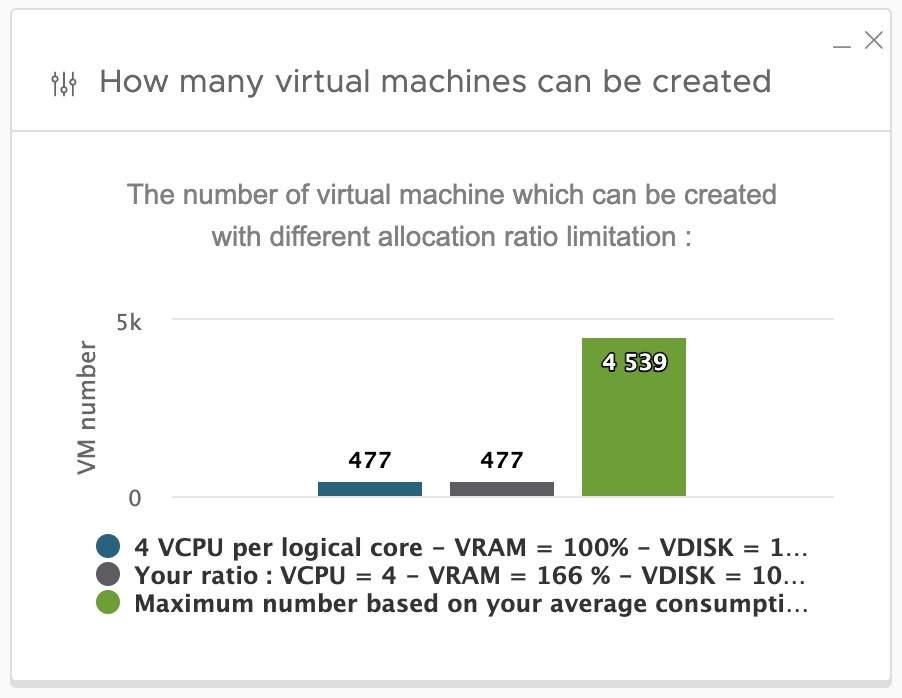
The second panel calculates the number of virtual machines that can still be be created on the infrastructure according to 3 criteria:
- In green on the right: according to the average consumption of the VMs (calculated on the basis of Green on the right: according to the average consumption of the VMs (calculated on the basis of the consumption of the filter VMs).
- In blue on the left: according to VMware's best practice allocation 4VCPU per logical core - 100% RAM allocation and 100% disk disk allocation.
- In the centre in grey: depending on the allocation level you want to apply to your filter you want to apply to your filter (level set in settings).
Optimization and cost analysis

The "opportunities" box is a consolidation indicator.
The simulation applies the DC Scope recommendations for oversized virtual machines virtual machines and simulates the removal of idle virtual machines.
Once these optimisations have been simulated, all running virtual machines are virtual machines are consolidated onto a minimum number of servers. The The servers are then used to their maximum capacity.
The metric avg power consumption metric shows the ratio of the power consumption power consumption of the optimised data centre and the current power consumption.
The metric carbon emission (kg CO2eq) is an estimate of the carbon emissions corresponding physical servers that can be decommissioned.
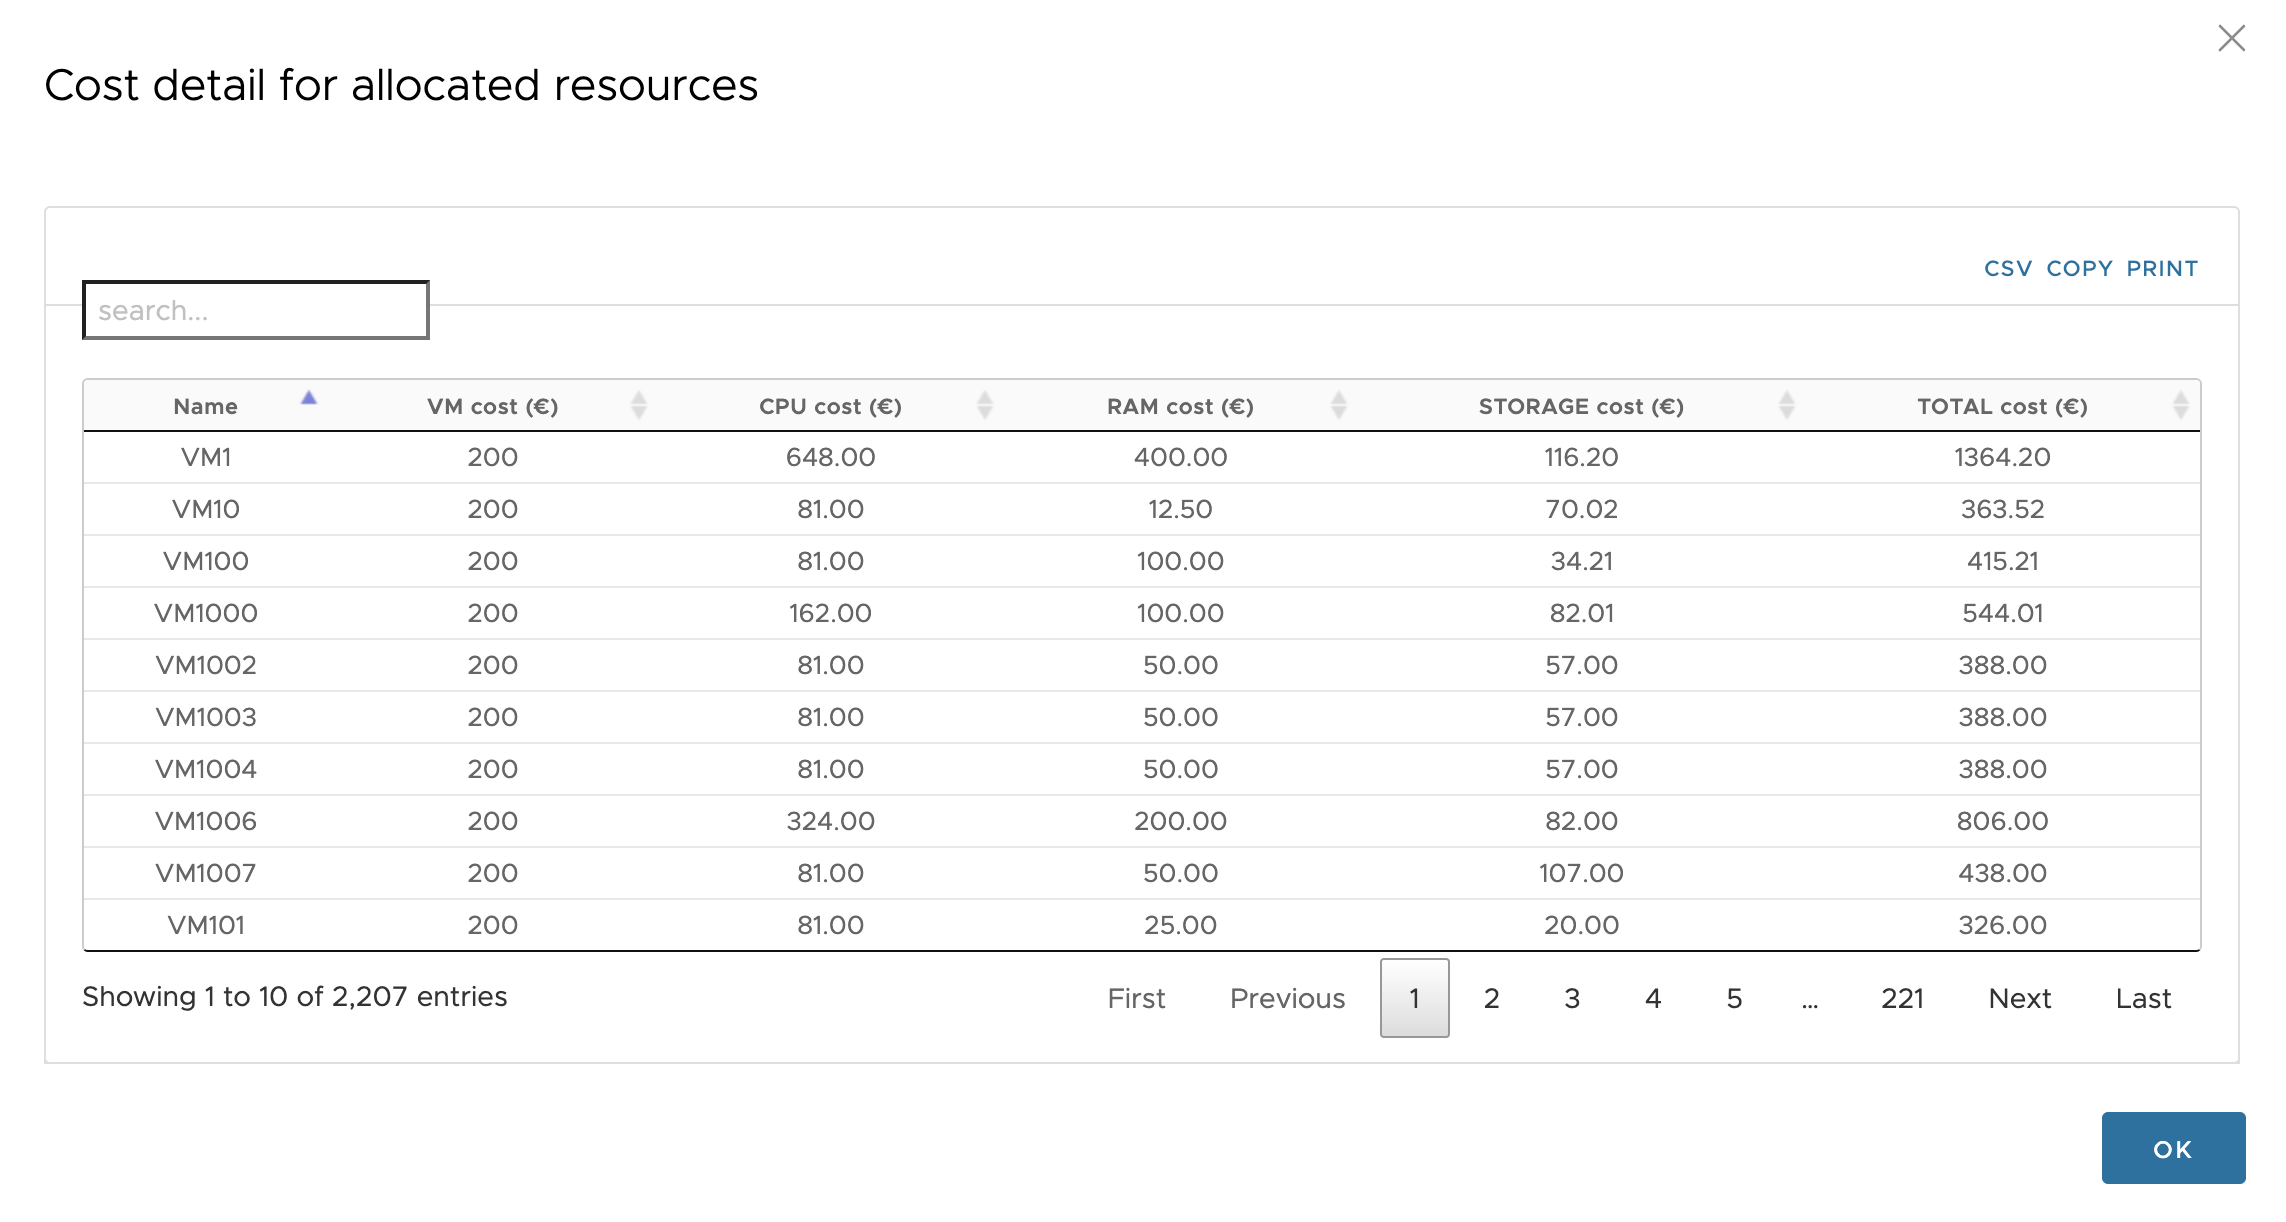
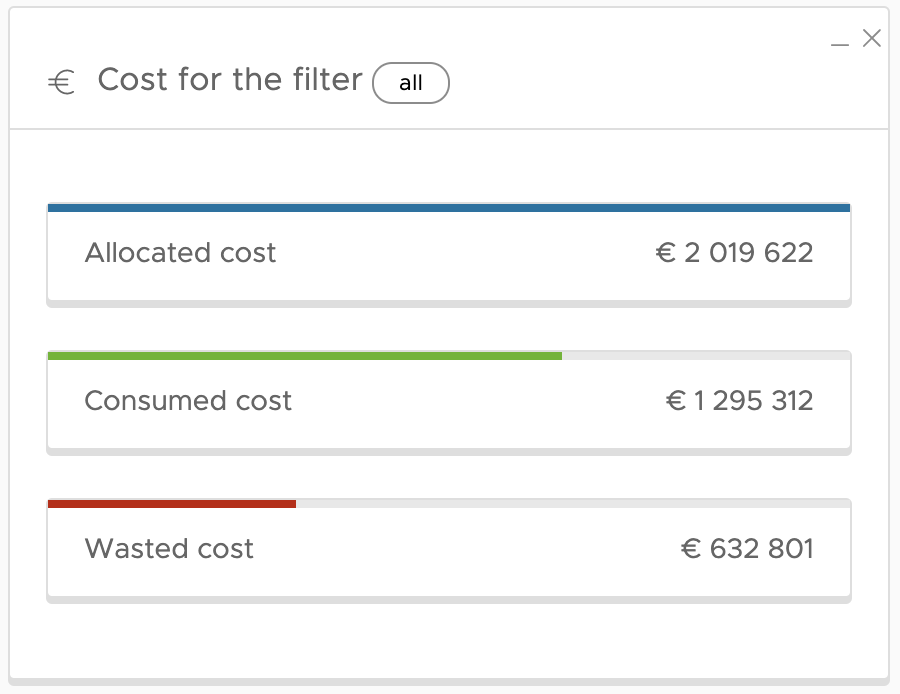
The second box in the column provides the infrastructure cost. This This box shows the cost for the scope analysed according to the filters. This allows you to calculate the cost per project, scope or cluster, or to calculate the cost of the total infrastructure.
DC Scope includes, by default, a list of costs corresponding to an average cost of our customers. These costs can be customised to suit your own to your own requirements. To define this cost either individually (per virtual machine) or generally, refer to the virtual machine), or generally, refer to the Cost Definition cost definition parameters.
On the basis of the allocated costs, DC Scope automatically calculates the costs: allocated , Consumed and wasted:
Allocated: The cost of allocated resources.
Consumed: the cost of consumed resources.
Wasted: the difference in cost between allocated and consumed resources for all resources consumed for all VMs; except normal VMs, & undersized.
By clicking on the different thumbnails allocated, consumed or wastedthe cost details per VM appear.